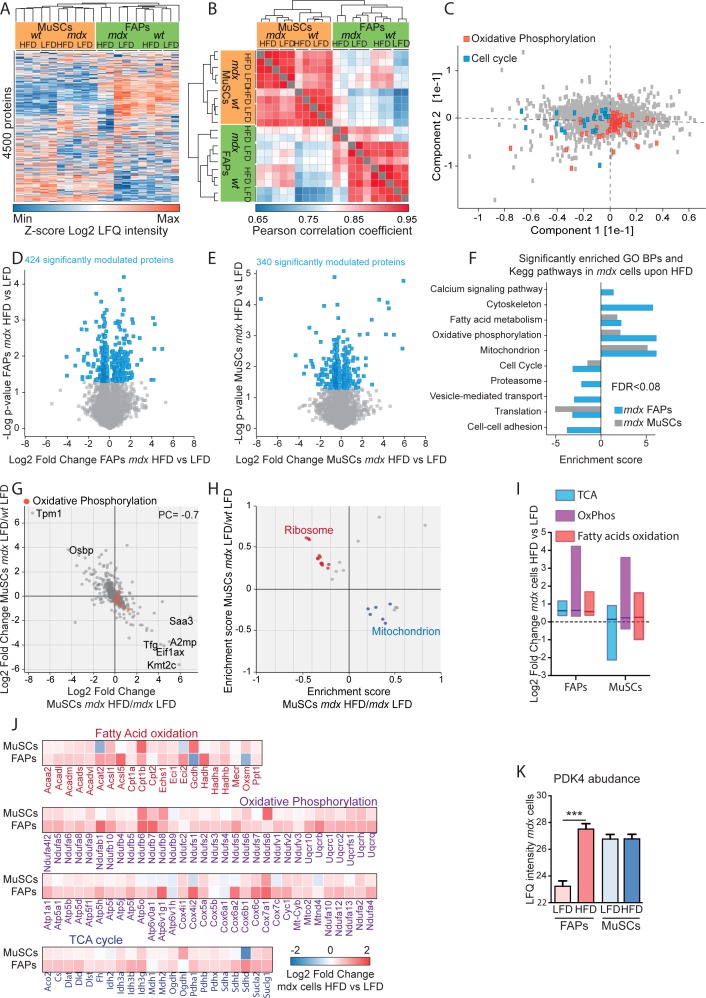
Figure S5. Summary of the proteomic approach. Referred to Fig 3.
(A) Unsupervised hierarchical clustering of 4,500 proteins show that biological replicates cluster together. (B) Heat map showing the Pearson correlation coefficients between the different biological replicates in the proteome. (C) The loadings of the principal component analysis reveal that the proteins responsible for driving sample separations in component 1 and component 2 are significantly enriched for the reported GOBPs (FDR < 0.05). (D, E) Statistically significant up- and down-regulated proteins in mdx muscle satellite cells (MuSCs) (D) and fibro/adipogenic progenitors (FAPs) (E) upon high-fat diet (HFD) were identified by t test (P < 0.05) and represented as scatterplot. (F) GOBPs and KEGG pathways significantly enriched (FDR < 0.08) in mdx MuSCs and FAPs upon HFD were represented as bar graph. (G) Scatterplot of the log2 fold change of expression level of 863 proteins significantly modulated in mdx MuSCs and upon HFD. (H) Two-dimensional annotation enrichment analysis of the significantly modulated proteins in mdx MuSCs and upon HFD. Groups of related GO terms are labelled with the same color, as described in the inset. (I) Boxplot of the HFD-dependent log2 fold change of the expression profile of metabolic enzymes involved in tricarboxylic acid cycle, OxPhos, and fatty acid oxidation in mdx cells. (J) Heat map of the HFD-dependent log2 fold change of the expression profile of metabolic enzymes involved in tricarboxylic acid cycle, OxPhos, and fatty acid oxidation in mdx cells. (K) LFQ intensity of PDK4 enzyme in mdx FAPs and MuSCs.

