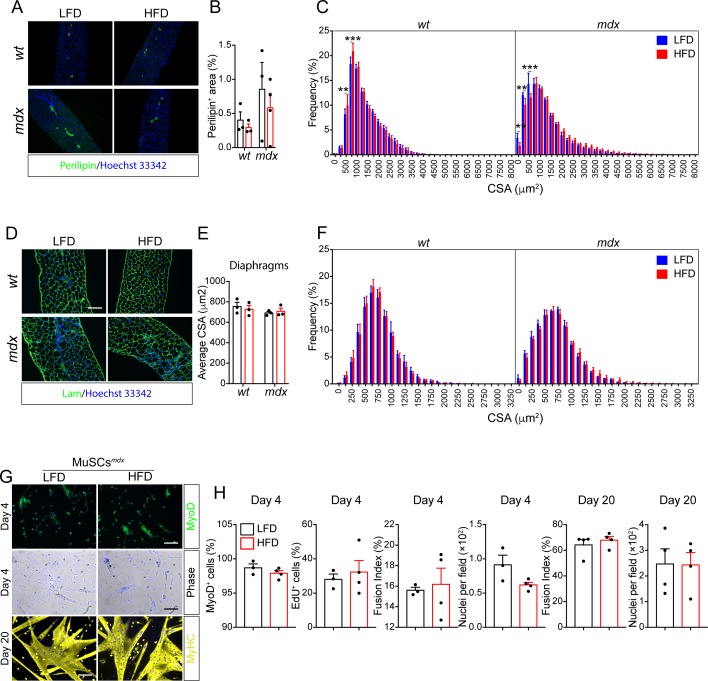
Figure S9. Short-term high-fat diet (HFD) improves the histological phenotype of mdx mice. Referred to Fig 5.
(A) Representative immunofluorescent showing perilipin-positive adipocytes in diaphragm muscles from 49-d-old wt and mdx mice. (B) Bar plot showing the average percentage of perilipin+ area over the whole section area (n = 3). Statistical significance was estimated by two-way ANOVA. (C) Bar plot reporting the average percentage of the frequency distribution of the myofiber areas (μm2) in tibialis anterior muscles for each experimental condition (wt LFD n = 8, wt HFD n = 6, mdx LFD n = 6, mdx HFD n = 6). Statistical significance was estimated by two-way ANOVA. (D) Representative micrographs of laminin-stained (green) diaphragm cross-sections (20× magnification; scale bar, 100 μm). (E) Bar plot reporting the average cross-sectional area (μm2). Statistical significance was estimated by two-way ANOVA. (F) Bar plot reporting the average percentage of the frequency distribution of the myofiber areas for each experimental condition (wt LFD n = 3; wt HFD n = 3; mdx LFD n = 3; mdx HFD n = 3). Statistical significance was estimated by two-way ANOVA. (G) Representative immunofluorescence of muscle satellite cells (MuSCs) purified from 49-d-old mdx mice treated for 28 d with LFD or HFD. MuSCs were immunostained with anti-Myod or anti-MyHC antibodies at the indicated time points. Nuclei (blue) were counterstained with Hoechst 33342. (H) Bar plots reporting the fraction of MyoD+ cells, EdU+ cells, and average number of nuclei per field (mdx MuSCs LFD n = 3; mdx MuSCs HFD n = 4). At day 20, the fusion index and the average number of nuclei per field is reported for MuSC-derived myotubes (mdx MuSCs LFD n = 3; mdx MuSCs HFD n = 4). Statistical significance was estimated by t test. All data are represented as mean ± SEM and statistical significance is defined as *P < 0.05; **P < 0.01; ***P < 0.001.

