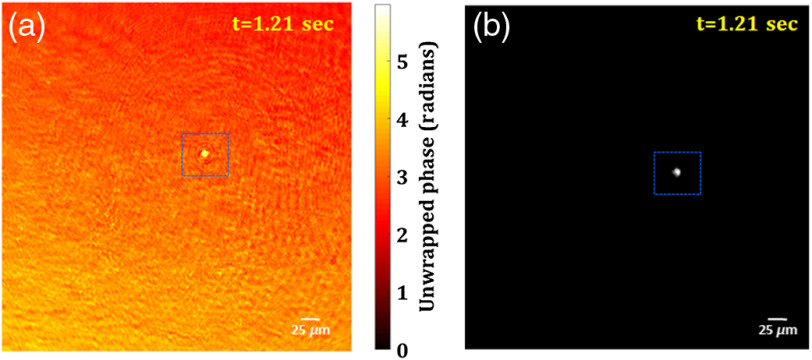
Fig. 11.
3-D live phase and FI results: (a) unwrapped phase map and (b) fluorescence image of the moving fluorescent bead at . Also, see Video 2 (mp4, 5984 KB [URL: https://doi.org/10.1117/1.JBO.25.3.032010.2]) (retrieved unwrapped phase distribution) and Video 3 (mp4, 75 KB [URL: https://doi.org/10.1117/1.JBO.25.3.032010.3]) (reconstructed fluorescence image).

