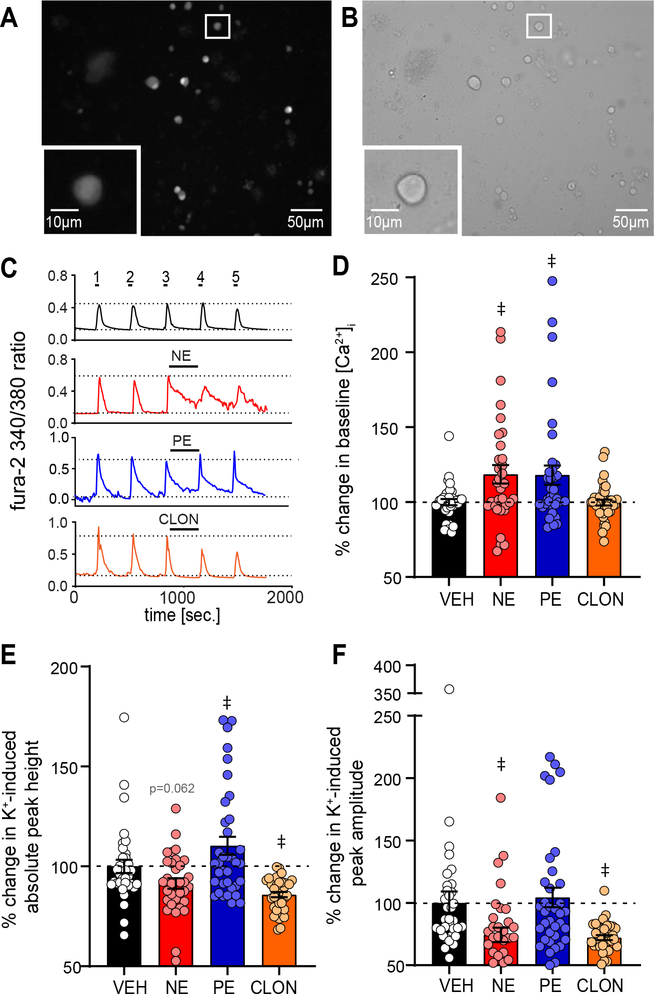
Figure 2. NE increases baseline [Ca2+]i in between depolarization induced [Ca2+]i peaks via α1-AR activation.
A,B: Example of isolated PVN neurons, 2 h after dissociation, under (A) 380nm excitation of fura-2 and (B) bright field. Inset shows a zoomed representative image of a recorded neuron. C: Example 340/380 ratios from single representative neurons over time from PVN neurons during repetitive high K+ depolarization (5X, 20 s each) intermittent with washes (imaging aCSF, 5X, 5 min). The third wash was with aCSF vehicle (VEH, black), NE (red), PE (blue), or CLON (orange). Note NE and PE increase [Ca2+]i between peaks 3 and 4, whereas CLON and aCSF VEH did not alter baseline activity. D-F: Average percent change in [Ca2+]i between peaks 3 and 4 normalized to the vehicle (VEH) for (D) baseline [Ca2+]i immediately prior to high K+ depolarization, (E) K+-induced total peak height, and (F) K+-induced peak amplitude (i.e., total peak height – baseline). D: NE significantly increased baseline [Ca2+]i, an effect mimicked by PE but not CLON. E: NE had a small, near significant decrease in K+-induced total peak height. F: NE and CLON significantly decrease K+-induced peak amplitude while PE did not significantly influence amplitude. Dashed line denotes VEH response for each drug combination. Data shown as individual cell responses overlaying mean ± SEM. aCSF VEH n = 34, NE n = 33, PE n = 36, CLON n = 38. ‡ p ≤ 0.05 vs. aCSF VEH by 1-way ANOVA with LSD.

