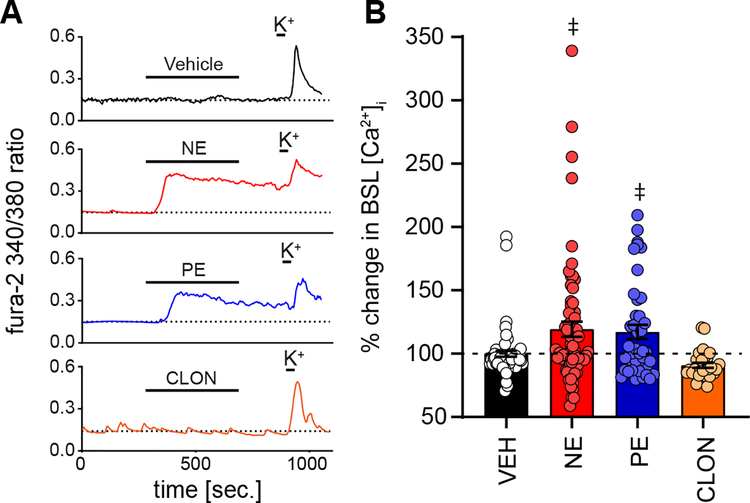
Figure 3. NE increases overall baseline [Ca2+]i via the α1-AR pathway.
A: Examples of 340/380 ratios from individual PVN neurons during exposure to 5 min of imaging aCSF (control), then 5 min of treatment, either aCSF vehicle (VEH, top, black), NE (red), PE (blue), or CLON (orange). Note the increase in baseline (BSL) [Ca2+]i by NE and PE, while CLON only produced a slight, non-significant decrease in BSL. High K+ at the end of the protocols, and the ensuing calcium peak, ensured cell viability. B: Average percent change in BSL [Ca2+]i, normalized to the equivalent aCSF vehicle, for aCSF VEH (n = 63), NE (n = 68), PE (n = 42), and CLON (n = 28). NE and PE, but not VEH or CLON, significantly increased BSL [Ca2+]i. Dashed line denotes VEH response for each drug combination. Data shown as individual cell responses overlaying mean ± SEM. ‡p ≤ 0.05 vs. VEH by 1-way ANOVA with LSD.

