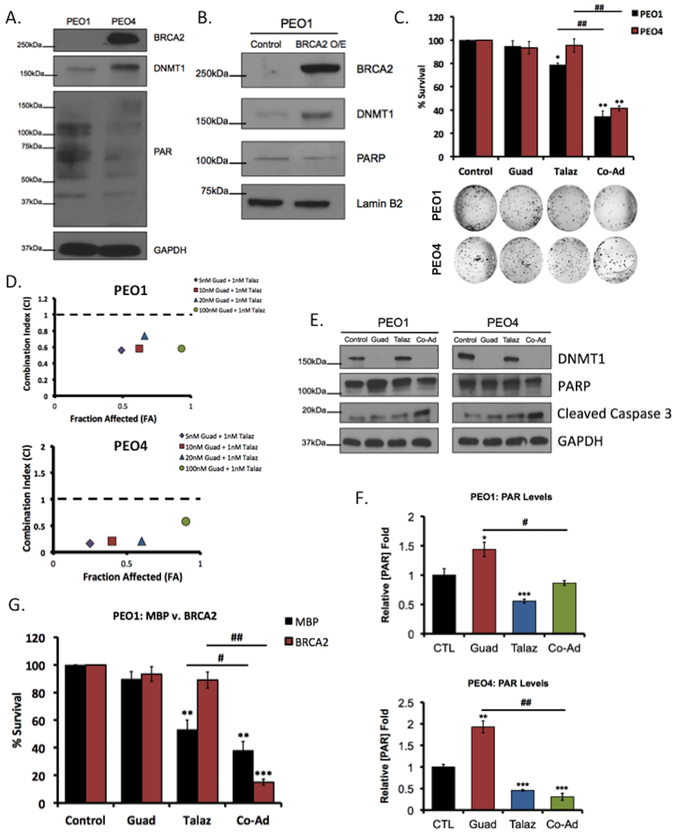
Figure 1. Therapeutic inhibition of DNMT1 promotes sensitivity to PARPi, independent of BRCA status.
Western blot showing endogenous BRCA2 and DNMT1 expression in (A) PEO1 and PEO4 cell lines and (B) in PEO1 cells overexpressing (O/E) vector control or BRCA2. (C) PEO1 and PEO4 cells were treated with 20nM guadecitabine (Guad) or 1nM talazoparib (Talaz), alone and in combination for 72hrs, and clonogenic cell survival assay was performed. Representative images of formed colonies are below. Quantification is representative of at least three individual experiments. (D) PEO1 and PEO4 cells were treated with guadecitabine and talazoparib for 72hrs, alone and in combination, and subjected to clonogenic survival assay to determine drug efficacy; x-axis is indicative of Fraction affected (FA), y-axis is indicative of the combination index (CI). Combinations beneath the black dashed line are synergistic. PEO1 and PEO4 cells were treated with 20nM Guad or 1nM Talaz for 72hrs, alone and in combination. (E) Cell lysates were subjected to western blot analysis against the indicated antibodies or (F) PAR-capture ELISA to measure PAR levels. (G) PEO1 cells ectopically expressing BRCA2 or vector control were treated with 20nM Guad and 1nM Talaz, alone or in combination, and subjected to colony formation assays. Results are representative of three independent experiments (Mean ± SEM). PAR, Poly (ADP-ribose); MBP, Maltose Binding Protein. * p<0.01, ** p<0.001, *** p<0.0001 compared to control, # p<0.01, ## p<0.001 relative to bracketed treatment.

