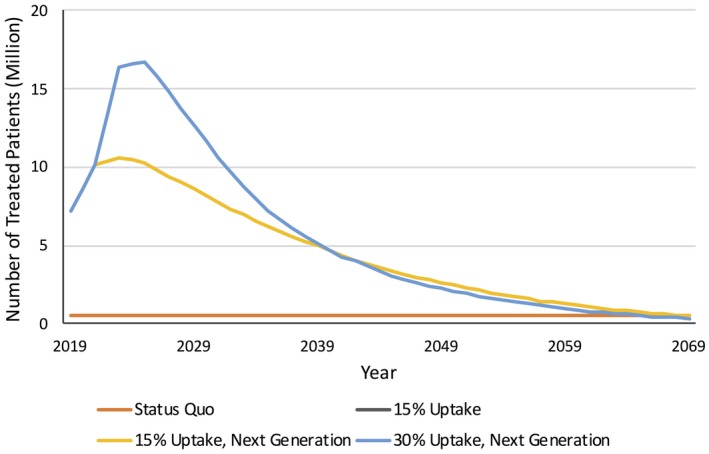
Figure 1.

Annual number of treated patients by scenario. Yellow and black lines overlap because of similar treatment uptake every year. Treated individuals were defined as patients who received treatment for at least 1 year. Individuals were not retreated once they discontinued antiobesity medication (AOM). The status quo scenario represents current rates of diet and exercise and no AOM use. The 15% uptake scenario represents 15% annual AOM uptake among eligible treatment‐naïve individuals starting in 2019. The 15% uptake, next generation scenario represents 15% annual AOM uptake among eligible treatment‐naïve individuals starting in 2019 and the availability of more efficacious AOM in 2023 onward. The 30% uptake, next generation scenario represents 15% annual AOM uptake among eligible treatment‐naïve individuals starting in 2019 until 2023 and the availability of more efficacious AOM combined with higher uptake (30%) in 2023 onward. The pool of AOM‐eligible individuals and the number of treated individuals increased over time as the population aged and decreased afterward because of AOM discontinuation and no retreatment. [Color figure can be viewed at https://www.wileyonlinelibrary.com]
