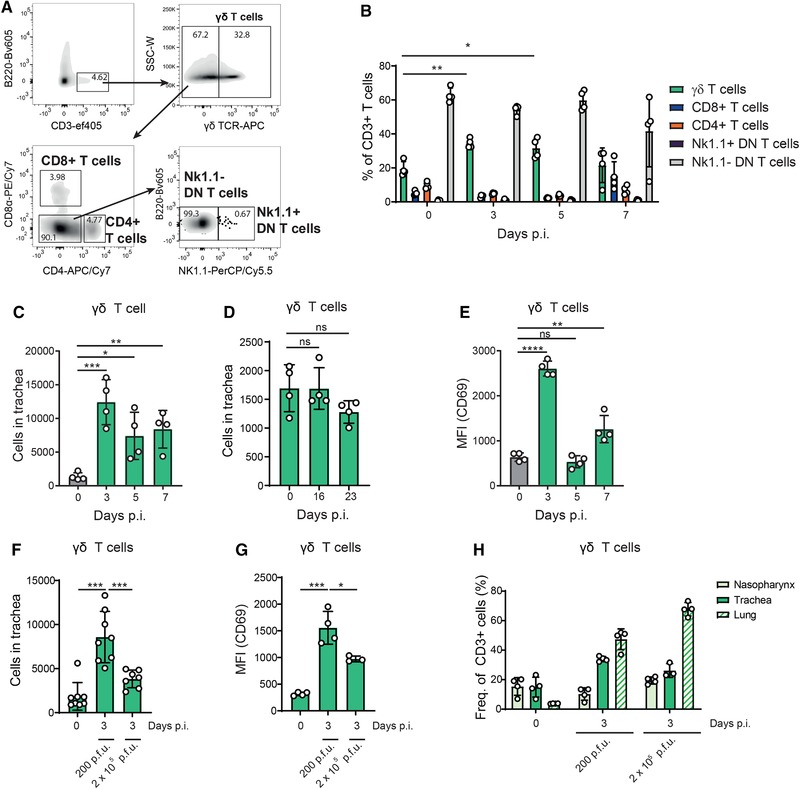
Figure 1.

γδ T cell dynamics in trachea from mice infected with influenza virus. (A) Representative flow cytometric characterization of γδ T cells (CD3+/B220–/γδ TCR+), CD8+ T cells (CD3+/B220–/γδ TCR–/CD8α+/CD4–), CD4+ T cells (CD3+/B220–/γδ TCR–/CD8α–/CD4+), NK1.1+ double negative (DN) T cells (CD3+/B220–/γδ TCR–/CD8α–/CD4–/NK1.1+), and NK1.1– DN T cells (CD3+/B220–/γδ TCR–/CD8α–/CD4–/NK1.1–) in mouse trachea. (B) Frequency of T cell subsets in trachea at 0, 3, 5, and 7 d.p.i. with PR8 (n = 4 mice/group). (C) Flow cytometry quantification of total numbers of γδ T cells in trachea at 0, 3, 5, and 7 d.p.i. (n = 4 mice/group). (D) Flow cytometry quantification of total numbers of γδ T cells in trachea at 0, 16, and 23 d.p.i. (n = 4 mice/group). (E) MFI expression levels of CD69 in tracheal γδ T cells at 0, 3, 5, and 7 d.p.i. (n = 4 mice/group). (F) Flow cytometry quantification of total numbers of γδ T cells in trachea at 0 and 3 d.p.i. with 200 or 2 × 10⁵ PFUs of PR8 (n = 7–8 mice/group). (G) MFI expression levels of CD69 in tracheal γδ T cells at 0 and 3 d.p.i. with 200 or 2 × 10⁵ PFUs of PR8 (n = 4 mice/group). (H) Flow cytometric analysis showing the frequency of γδ T cell in nasopharynx, trachea and lungs at 0 and 3 d.p.i. with 200 and 2 × 10⁵ PFUs of PR8 (n = 4 mice/group). The presented data are representative of at least three independent experiments (A, B, C, and E) or two independent experiments (D, F, G, and H) and analyzed using flow cytometry. Results are given as mean ± SD. Statistical significance was determined by Two‐tailed Student's t‐test (B, C, E) or Mann–Whitney U‐test (D, F, G). ns, p > 0.05; * p < 0.05; ** p < 0.01; *** p < 0.001; **** p < 0.0001.
