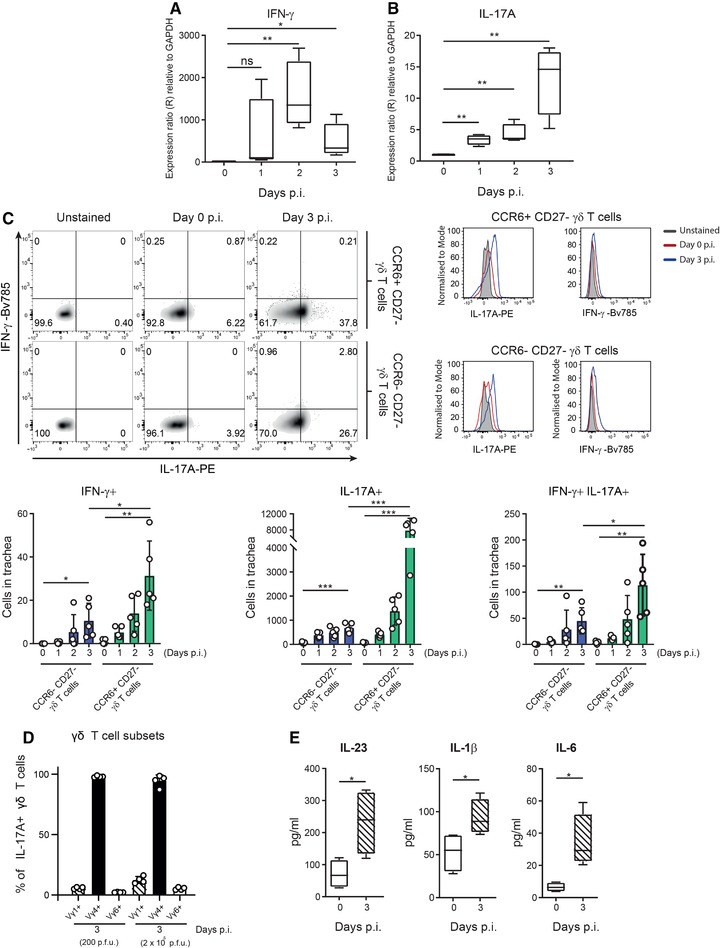
Figure 4.

Vγ4+ γδ T cells produce IL‐17A during influenza infection. Time course showing RNA expression of IFN‐γ (A) and IL‐17A (B) in mouse trachea during the first 3 d.p.i. by qPCR (n = 4 mice/group). (C) Representative scatterplots and histograms showing the flow cytometric characterization of IFN‐γ‐ and/or IL‐17A‐producing cells from CCR6+ CD27– γδ T cell and CCR6– CD27 γδ T cell subsets in trachea at 3 d.p.i. (Upper panel) and their quantification (lower graphs; n = 4 mice/group). (D) Flow cytometric quantification of frequency of the different γδ T cell subtypes that express IL‐17A in trachea at 0 and 3 d.p.i. with 200 or 2 × 10⁵ PFUs of PR8 (n = 4 mice/group). (E) Protein levels of secreted IL‐23, IL‐1β, and IL‐6 in trachea at 0 and 3 d.p.i. determined by bead‐based immunoassay (LEGENDplexTM, BioLegend; n = 4 mice/group). The presented data are representative of at least three (A–C, E) or two (D) independent experiments. Results are given as mean ± SD. In (A), (B), and (E), box plots show 25th to 75th percentiles and whiskers show minimum and maximum values. Statistical significance was determined by two‐tailed Student's t‐test. ns, p > 0.05; * p < 0.05; ** p < 0.01; *** p < 0.001.
