Figure 2.

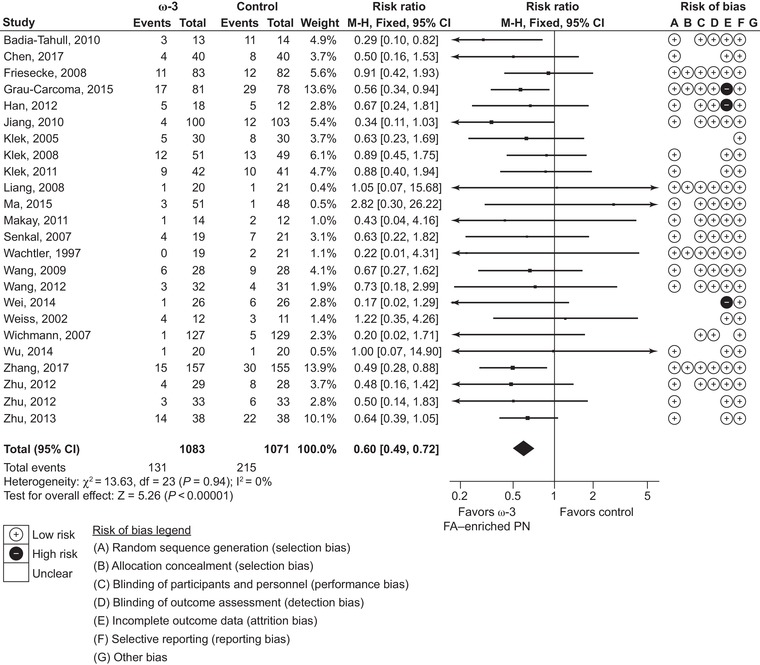
Infection rates. Forest plot of fixed effects meta‐analysis showing individual study means, pooled estimates, and risk of bias for individual studies (Cochrane tool). CI, confidence interval; FA, fatty acid; PN, parenteral nutrition.

Infection rates. Forest plot of fixed effects meta‐analysis showing individual study means, pooled estimates, and risk of bias for individual studies (Cochrane tool). CI, confidence interval; FA, fatty acid; PN, parenteral nutrition.