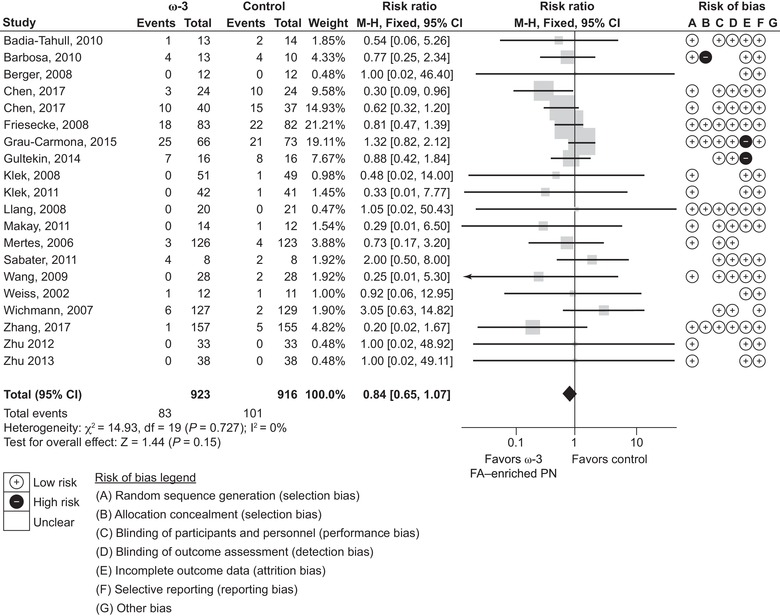
Figure 3.

Thirty‐day mortality rates. Forest plot of fixed effects meta‐analysis showing individual study means, pooled estimates, and risk of bias for individual studies (Cochrane tool). Note: to correct for the 0 event studies as per the protocol (to add 0.5 events in both arms), this meta‐analysis was performed using STATA software, as it is difficult to use RevMan for this correction. CI, confidence interval; FA, fatty acid; PN, parenteral nutrition.
