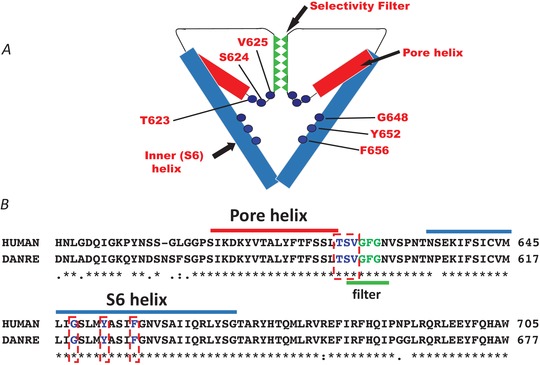
Figure 5. Homology of ERG channels.

Schematic representation (A) and sequence homology (B) of pore‐helix and S6 helix regions between hERG and zERG channels. Sequence alignments made in UniProt (Q12809 and Q8JH78). The pore‐helix is highlighted in red and S6 helix in blue. The GFG selectivity sequence is highlighted in green. Residues known to contribute to the canonical drug binding site in hERG are highlighted by red dashed boxes. Note that residue numbering in A refers to amino acid position in hERG. hERG:zERG equivalents: T623 = T595; S624 = S596; V625 = V597; G648 = G620; Y652 = Y624; F656 = F628.
