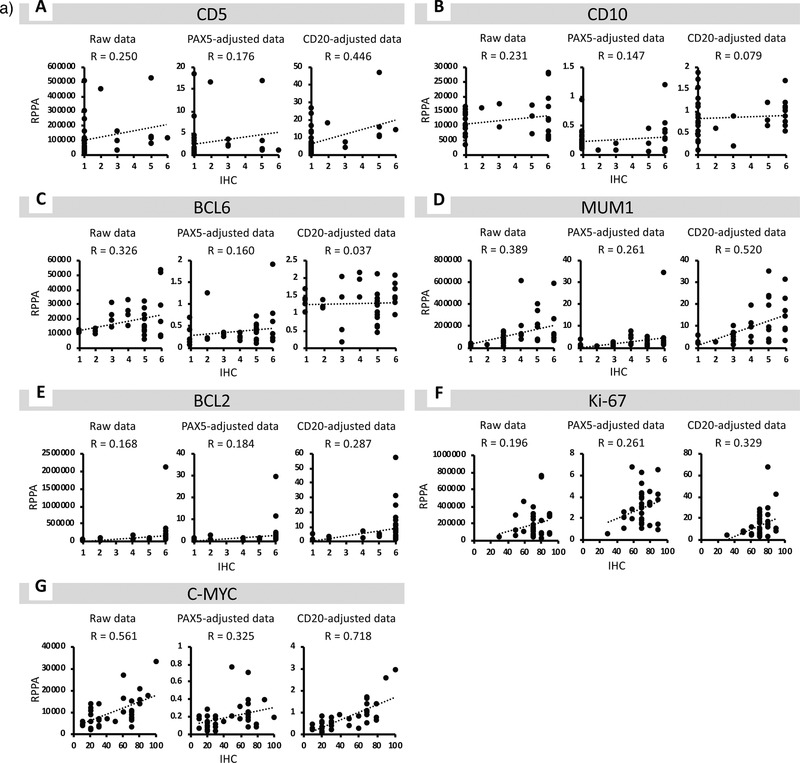
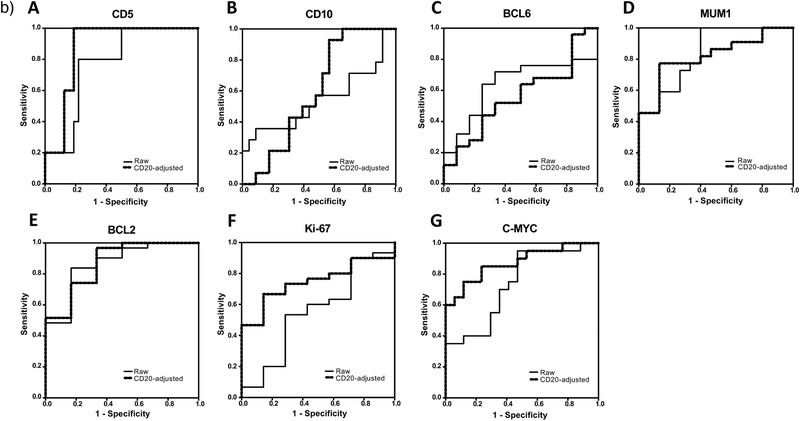
Figure 3.
a) Correlation between the results of reverse phase protein array (RPPA) and immunohistochemistry (IHC) for each marker. A) For CD5, the correlation coefficient with IHC data was highest in CD20‐adjusted data and lowest in PAX5‐adjusted data. B) For CD10, the correlation coefficient with IHC data was highest in the raw data and lowest in CD20‐adjusted data. C) For BCL6, the correlation coefficient with IHC data was highest in the raw data and lowest in CD20‐adjusted data. D) For MUM1, the correlation coefficient with IHC data was highest in CD20‐adjusted data and lowest in PAX5‐adjusted data. E) For BCL2, the correlation coefficient with IHC data was highest in CD20‐adjusted data and lowest in the raw data. F) For Ki‐67, the correlation coefficient with IHC data was highest in CD20‐adjusted data and lowest in the raw data. G) For C‐MYC, the correlation coefficient with IHC data was highest in CD20‐adjusted data and lowest in PAX5‐adjusted data. R = correlation coefficient. b) Receiver operating characteristic (ROC) analysis of the signal intensities obtained by reverse phase protein array (RPPA) analysis. A) ROC curves of the raw and CD20‐adjusted RPPA data for CD5. B) ROC curves of the raw and CD20‐adjusted RPPA data for CD10. C) ROC curves of the raw and CD20‐adjusted RPPA data for BCL6. D) ROC curves of the raw and CD20‐adjusted RPPA data for MUM1. E) ROC curves of the raw and CD20‐adjusted RPPA data for BCL2. F) ROC curves of the raw and CD20‐adjusted RPPA data for Ki‐67. G) ROC curves of the raw and CD20‐adjusted RPPA data for C‐MYC.