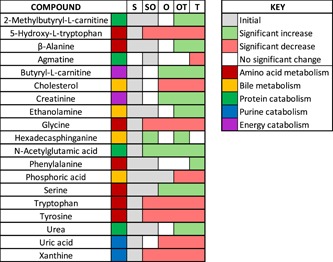
Figure 5.

Trends in significant metabolite abundance changes of uterine flushings over the progression of blastocyst early elongation. Gray boxes represent initial metabolite abundance; green boxes represent a significant increase in metabolite abundance, while red boxes represent a significant decrease in metabolite abundance at the corresponding conceptus morphologies. Colors next to the metabolite name classify metabolites into categories of related metabolites. O, uniform ovoid; OT, heterogeneous ovoid and tubular; S, uniform spherical; SO, heterogeneous spherical and ovoid; T, uniform tubular [Color figure can be viewed at wileyonlinelibrary.com]
