Figure 1.

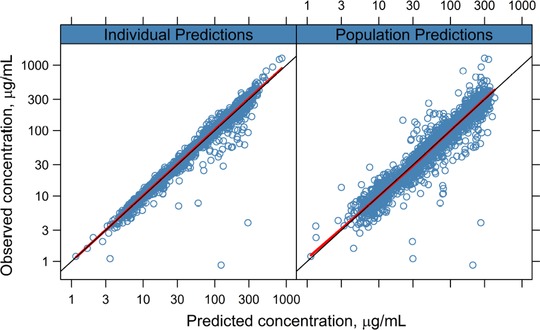
Goodness of fit for the final model. Observed values plotted against predicted values overlaid with smoothing function (solid red line) and unity line (solid black line).

Goodness of fit for the final model. Observed values plotted against predicted values overlaid with smoothing function (solid red line) and unity line (solid black line).