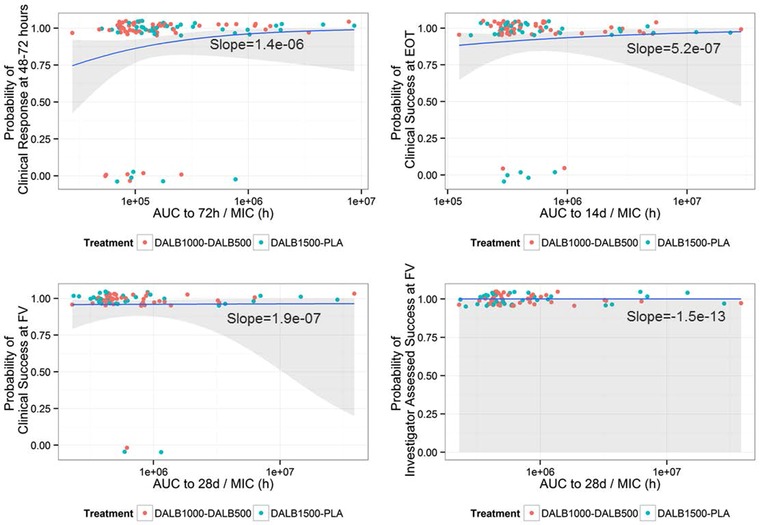
Figure 3.

Logistic regression models of end points against AUC/MIC. X axis is logarithmic scale. AUC, area under the curve; MIC, minimum inhibitory concentration. Responses (points) jittered at 0 (failure) or 1 (success) overlaid with logistic regression (blue line) and 95%CI (shaded area).
