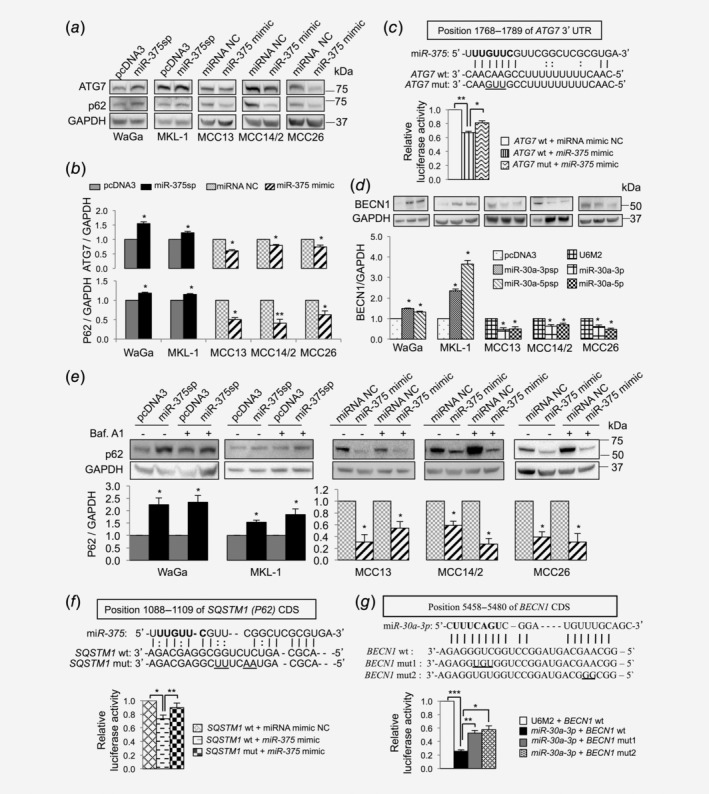
Figure 5.

miR‐375, miR‐30a‐3p and miR‐30a‐5p target multiple autophagy genes. (a, b) miR‐375 regulates ATG7 and p62 expression. (a) Representative Western blots showing the effect of miR‐375 silencing (miR‐375sp) or overexpression (miR‐375 mimic) on ATG7 and p62 expression in MCPyV+ and MCPyV− MCC cell lines. (b) Quantification of ATG7 and p62 protein levels in MCPyV+ MCC cell lines upon inhibition of miR‐375 expression and in MCPyV− MCC cell lines upon overexpression of miR‐375. The expression was normalized to GAPDH, and their respective vector controls were set to 1 (n = 3). (c) Verification of ATG7 as a direct target of miR‐375 in MCC. Upper: Illustrations of sequence alignment of miR‐375 and the wild‐type (wt) and the mutated (mut) target sequence of ATG7. The seed sequence of miR‐375 is highlighted in bold and the mutated sequence is underlined. Lower: The effect of miR‐375 on luciferase activity was evaluated 24 hr after cotransfection of miR‐375 mimic or NC together with the wt or mut of ATG7 reporter constructs in MCC14/2 cells. (d) Effect of miR‐30a‐3p and miR‐30a‐5p regulation on BECN1 expression. Top: Representative Western blot images showing the effect of miR‐30a‐3p and miR‐30a‐5p on BECN1 expression. Bottom: Quantification of BECN1 expression normalized to GAPDH and vector control‐treated cells were set to 1 (n = 4). (e) Experiments described in (a) were repeated with DMSO or bafilomycin A1 treatment (40 nM for 2 hr). Top: Representative Western blot images showed the effect on p62 expression in the presence or absence of bafilomycin A1. Bottom: Quantification of p62 levels normalized to GAPDH (n = 3). (f, g) Validation of SQSTM1 and BECN1 as novel targets of miR‐375 and miR‐30a‐3p, respectively, by luciferase reporter assays (n = 3). The seed sequence is in bold and the mutated sequences are underlined. (b–g) Error bars refer to SEM. *p < 0.05, **p < 0.01, ***p < 0.001 by paired Student's t‐test.
