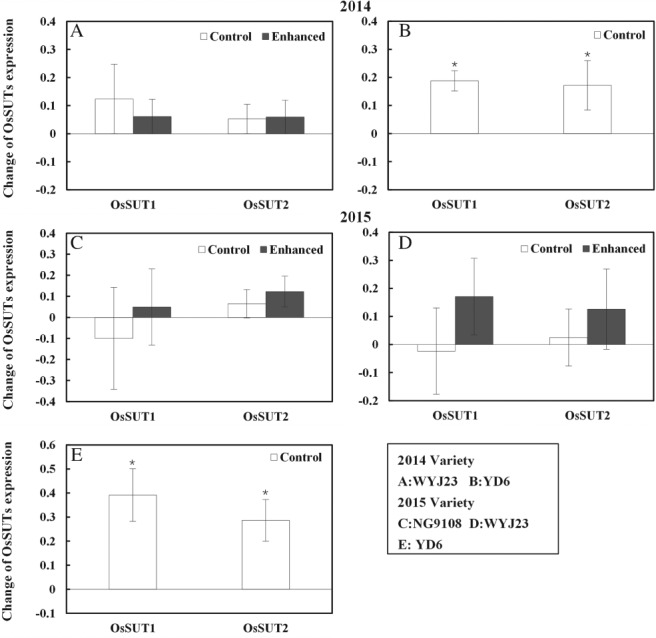
Figure 3.

Change of OsSUT1 and OsSUT2 (OsSUTs) expression level of flag leaves under elevated CO2 for three rice cultivars in each sink:source treatment. ‘Enhanced’ indicates the increased sink:source ratio through leaves removal, and the unaltered sink:source ratio is represented by ‘Control’. Bars represent the average (E‐A)/A (relative change at elevated CO2 to those at ambient CO2) of three replicates for OsSUTs expression level with relative standard errors. Symbols indicate the significant difference for the gene expression as a function of CO2 treatment. ns, not significant. P > 0.1; †P ≤ 0.1; *P ≤ 0.05; **P ≤ 0.001.
