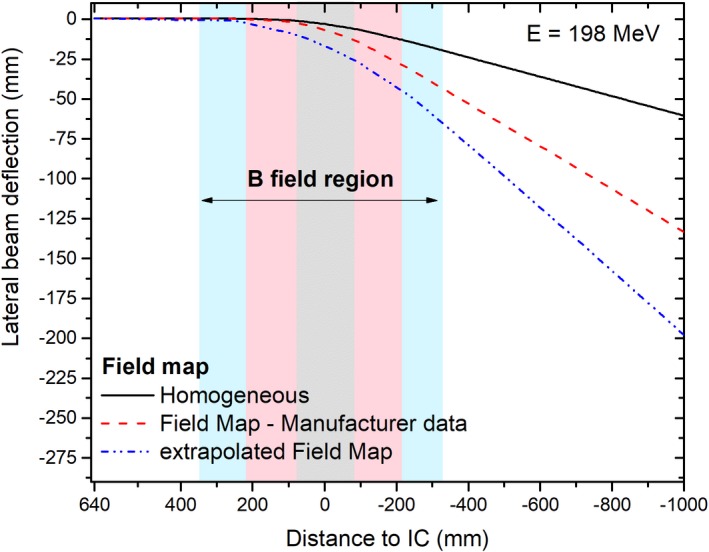
Figure 3.

Simulated lateral beam deflection of proton beams accounting for all components of the magnetic field map. The three field map regions are highlighted in the graph in light gray (homogeneous region only), pink (manufacturer measured data), and cyan (extrapolated data), see online color version. [Color figure can be viewed at http://www.wileyonlinelibrary.com]
