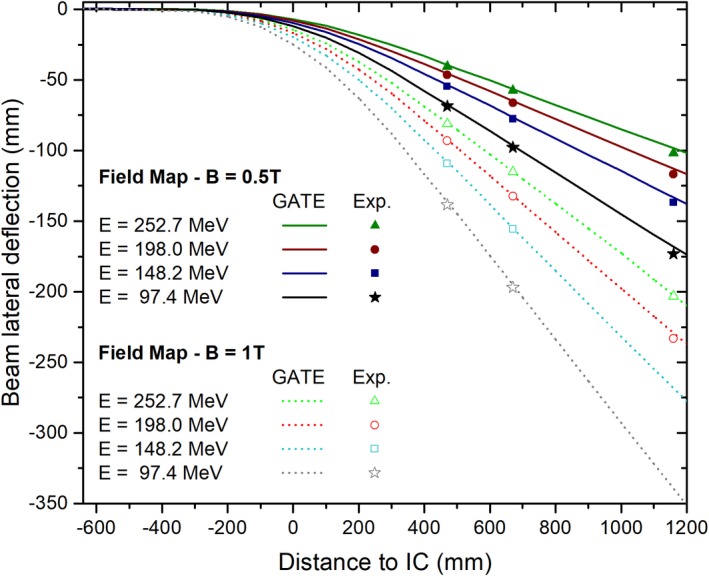
Figure 5.

Simulated and measured lateral deflections of proton beams interacting with magnetic field strengths of 0.5 and 1 T. Measurements are displayed as points, while simulated beam trajectories are presented in continuous and dotted lines. [Color figure can be viewed at http://www.wileyonlinelibrary.com]
