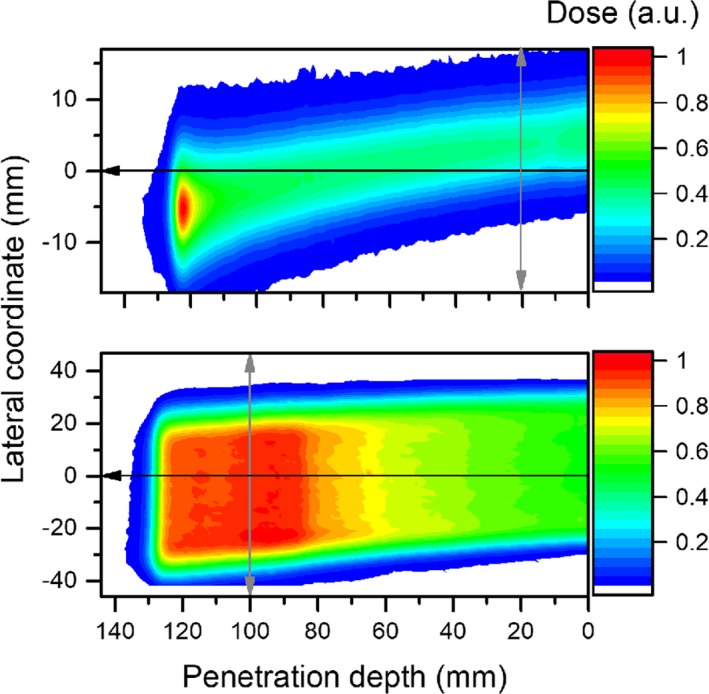
Figure 6.

EBT3 measured dose from deflected proton beams passing through a magnetic field (B = 1 T), using a single pencil beam (top) and a 40 × 40 × 40 mm3 cubic target (bottom) irradiations. The black and gray arrows indicate the directions in which in‐depth and lateral dose profiles were scored, respectively. [Color figure can be viewed at http://www.wileyonlinelibrary.com]
