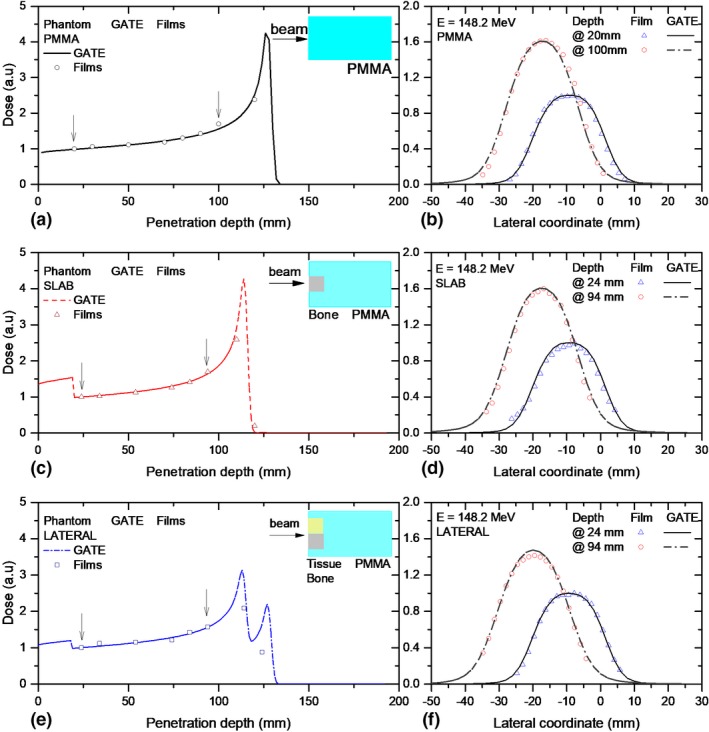
Figure 8.

Integrated dose distributions (a,c,e) and lateral (b,d,f) profiles measured with EBT3 films and simulated with GATE for proton beams passing through a magnetic field region of B = 1 T and three phantom material configurations. A simple schematic illustration of the phantom material/geometry is shown as reference on the right top area of the plots. The arrows indicate the positions at which the lateral profiles were scored for comparison. [Color figure can be viewed at http://www.wileyonlinelibrary.com]
