
Figure 4.
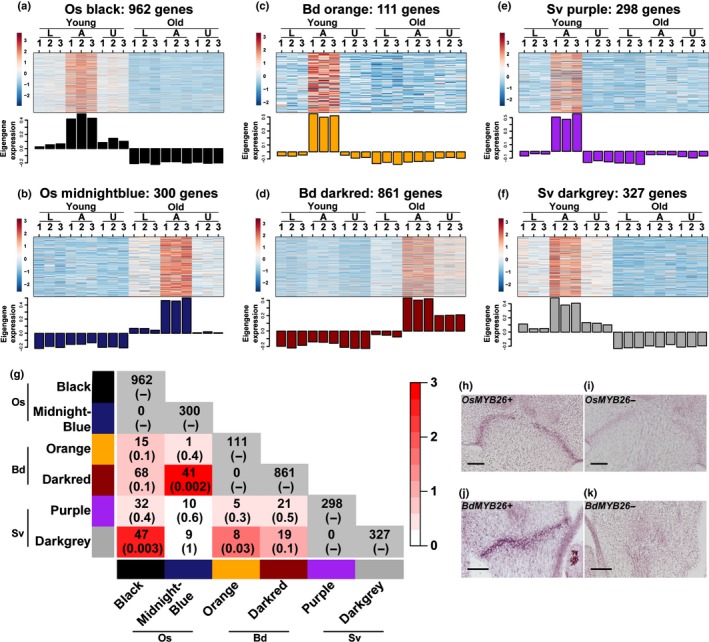
The number of overlapping genes between abscission zone (AZ) modules is small among the three species. (a–f) Heatmap and eigengene bar graph of (a) rice young AZ module (black), (b) rice old AZ module (midnightblue), (c) Brachypodium young AZ module (orange), (d) Brachypodium old AZ module (darkred) and (e, f) Setaria young AZ modules (purple and darkgrey). (g) Pairwise comparisons of the number of overlapping genes between modules. The numbers in parentheses are P‐values from Fisher's exact test to test statistical significance of overlap between two modules. White to red colour key indicates –log10(P‐value). Module comparisons within species are not meaningful and indicated with grey colour. (h–k) In situ hybridisation of MYB26 in (h, i) rice and (j, k) Brachypodium. (h, j) antisense probes; (i, k) sense probes. Bars, 50 μm.