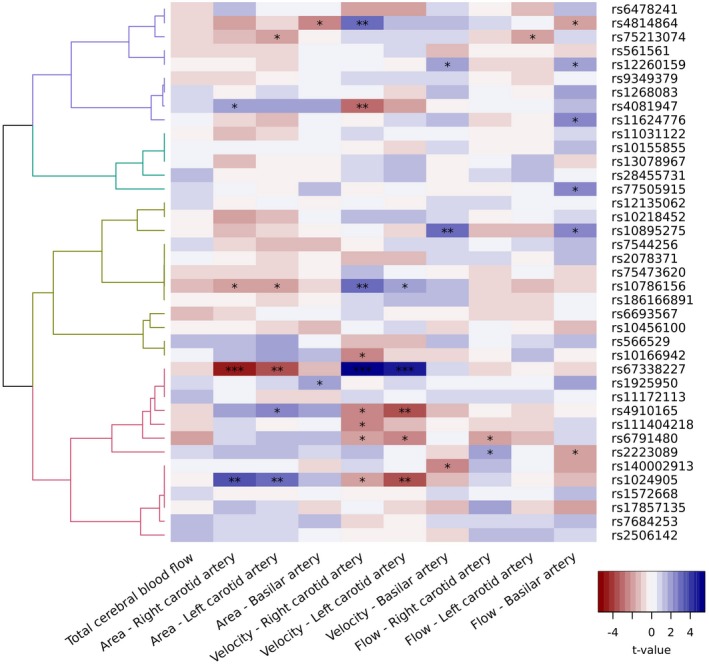
Figure 4.

Associations between genetic risk variants for migraine and CBF, hierarchically clustered based on the enrichment of their associated genes in brain, vascular, and gastrointestinal tissues. Plot showing association results between 39 autosomal migraine genetic risk variants and measures of CBF, including a dendrogram based on the tissue enrichment in brain, vascular, and gastrointestinal tissues of their associated genes. The genetic variants in each cluster are linked to genes that are differentially enriched in tissues: vascular, brain, and gastrointestinal tissues (purple branches); brain tissue (green branches); vascular and gastrointestinal tissues (yellow branches); vascular tissue (pink branches). Colors and sizes of the blocks correspond to t values, with blue and red indicating positive and negative associations, respectively. Significance levels are noted by asterisks: * for P value <.05, ** for P value <.05/8.2 = 6.1 × 10⁻³, and *** for P value <.05/(43 × 8.2) = 1.4 × 10⁻⁴.
