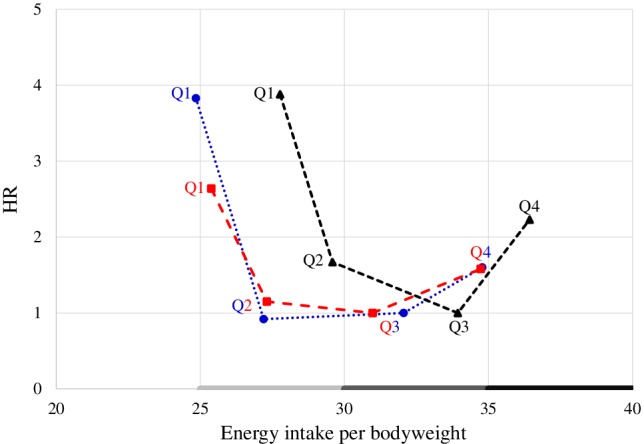
Figure 1.

Graphical scheme of the relationship between the hazard ratio (HR) for mortality and energy intake per actual, standard or target bodyweight. The HR is plotted on the y‐axis and energy intake per actual ( ), standard (
 ) or target (
 ) bodyweight is plotted on the x‐axis using model 4. Q, quartile.
