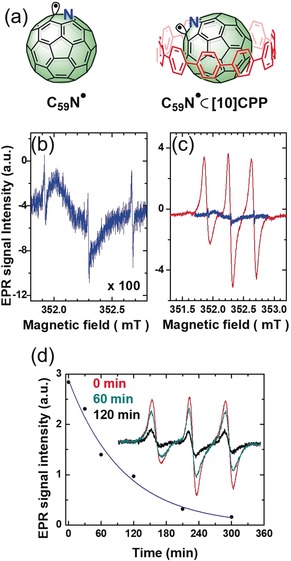
Figure 2.

a) Structures of C59N. and C59N.⊂[10]CPP radicals. b) The X‐band EPR spectrum of bare C59N. in 1‐chloronaphthalene solution. c) Comparison of the solution X‐band EPR spectra of C59N.⊂[10]CPP (red) and C59N. (blue). All measurements were conducted at room temperature in degassed 1‐chloronaphthalene with samples possessing equal concentrations (2.3 mm). d) Time dependence of the X‐band EPR signal of C59N.⊂[10]CPP in 1‐chloronaphthalene after the illumination at 532 nm has been switched off. The solid blue line is a fit to an exponential time decay yielding the characteristic decay of 100 min. Inset: Comparison of spectra recorded during illumination (red), 60 min after switching off the light (cyan), and 120 min after switching off the light (black).
