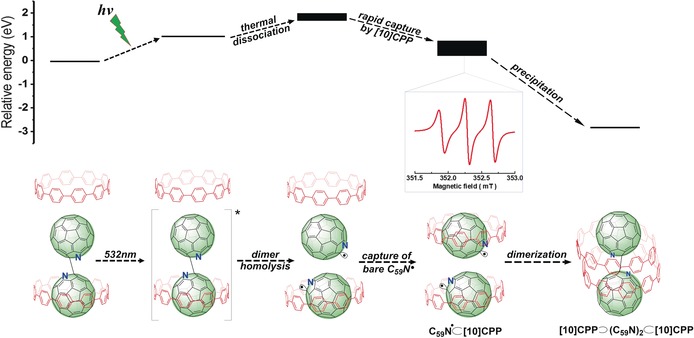
Figure 3.

Top: DFT‐calculated relative energies for the different species; finite width bars indicate energy ranges dependent on the relative orientation of C59N. and [10]CPP in the radical complex. Bottom: Illustration of the light‐induced generation of the C59N.⊂[10]CPP radical complex and the decay pathway. Inset: The EPR signal of long‐lived C59N.⊂[10]CPP.
