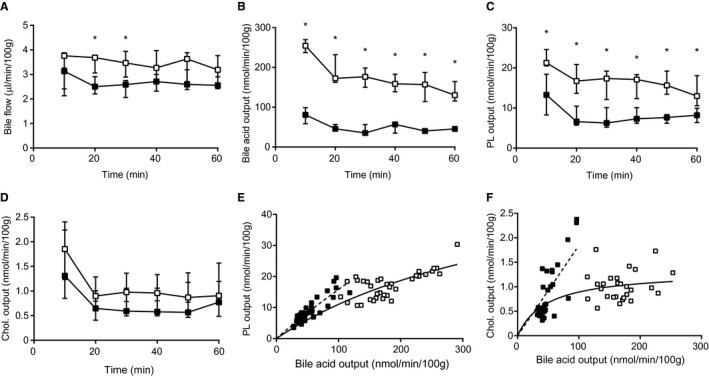
Figure 5.

Total inhibition bile salt uptake reduces biliary bile salt and phospholipid output, but maintains biliary cholesterol output. (A) Bile flow, (B) biliary bile salt output, (C) biliary phospholipid output, and (D) biliary cholesterol output into bile (in nmol/min/100 g BW) in hOATP1B1 Oatp1a/1b −/− mice. (E) Cholesterol output and (F) phospholipid output were plotted as a function of biliary bile salt (linear regression was performed on log transformed data and significance was assessed by comparing slopes or intercepts). Data are presented as median and interquartile range. White squares/bars indicate the vehicle group, and black/gray squares/bars indicate the Myrcludex B group. Differences between groups were analyzed using the Mann‐Whitney U test. Asterisk (“*”) indicates P < 0.05; n = 8 mice/group. Abbreviations: Chol., cholesterol; PL, phospholipid.
