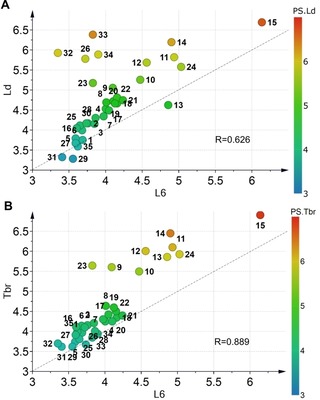
Figure 3.

Scatter plots of (A) antileishmanial (L. donovani, Ld) and (B) antitrypanosomal (T. brucei rhodesiense, Tbr) activity vs. cytotoxicity against L‐6 cells (pIC50 values). Compounds are color‐coded according to their respective antiparasitic activity; R‐Pearson's correlation coefficient. The dashed grey lines are not trend lines but represent the diagonal for easier orientation.
