
Figure 4.
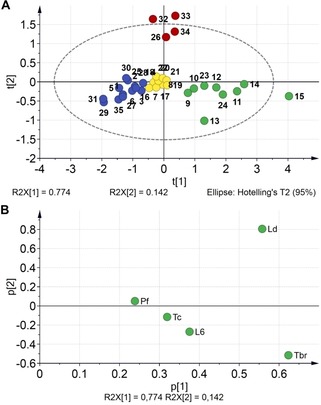
Score (A) and loadings (B) plots of a PCA on the pIC50 values. The scores are color‐coded according to clusters obtained by HCA. Ld: L. donovani; Tc: T. cruzi; Tbr: T. brucei rhodesiense; Pf: P. falciparum; L6: rat skeletal myoblasts.
Official websites use .gov
A
.gov website belongs to an official
government organization in the United States.
Secure .gov websites use HTTPS
A lock (
) or https:// means you've safely
connected to the .gov website. Share sensitive
information only on official, secure websites.
Score (A) and loadings (B) plots of a PCA on the pIC50 values. The scores are color‐coded according to clusters obtained by HCA. Ld: L. donovani; Tc: T. cruzi; Tbr: T. brucei rhodesiense; Pf: P. falciparum; L6: rat skeletal myoblasts.