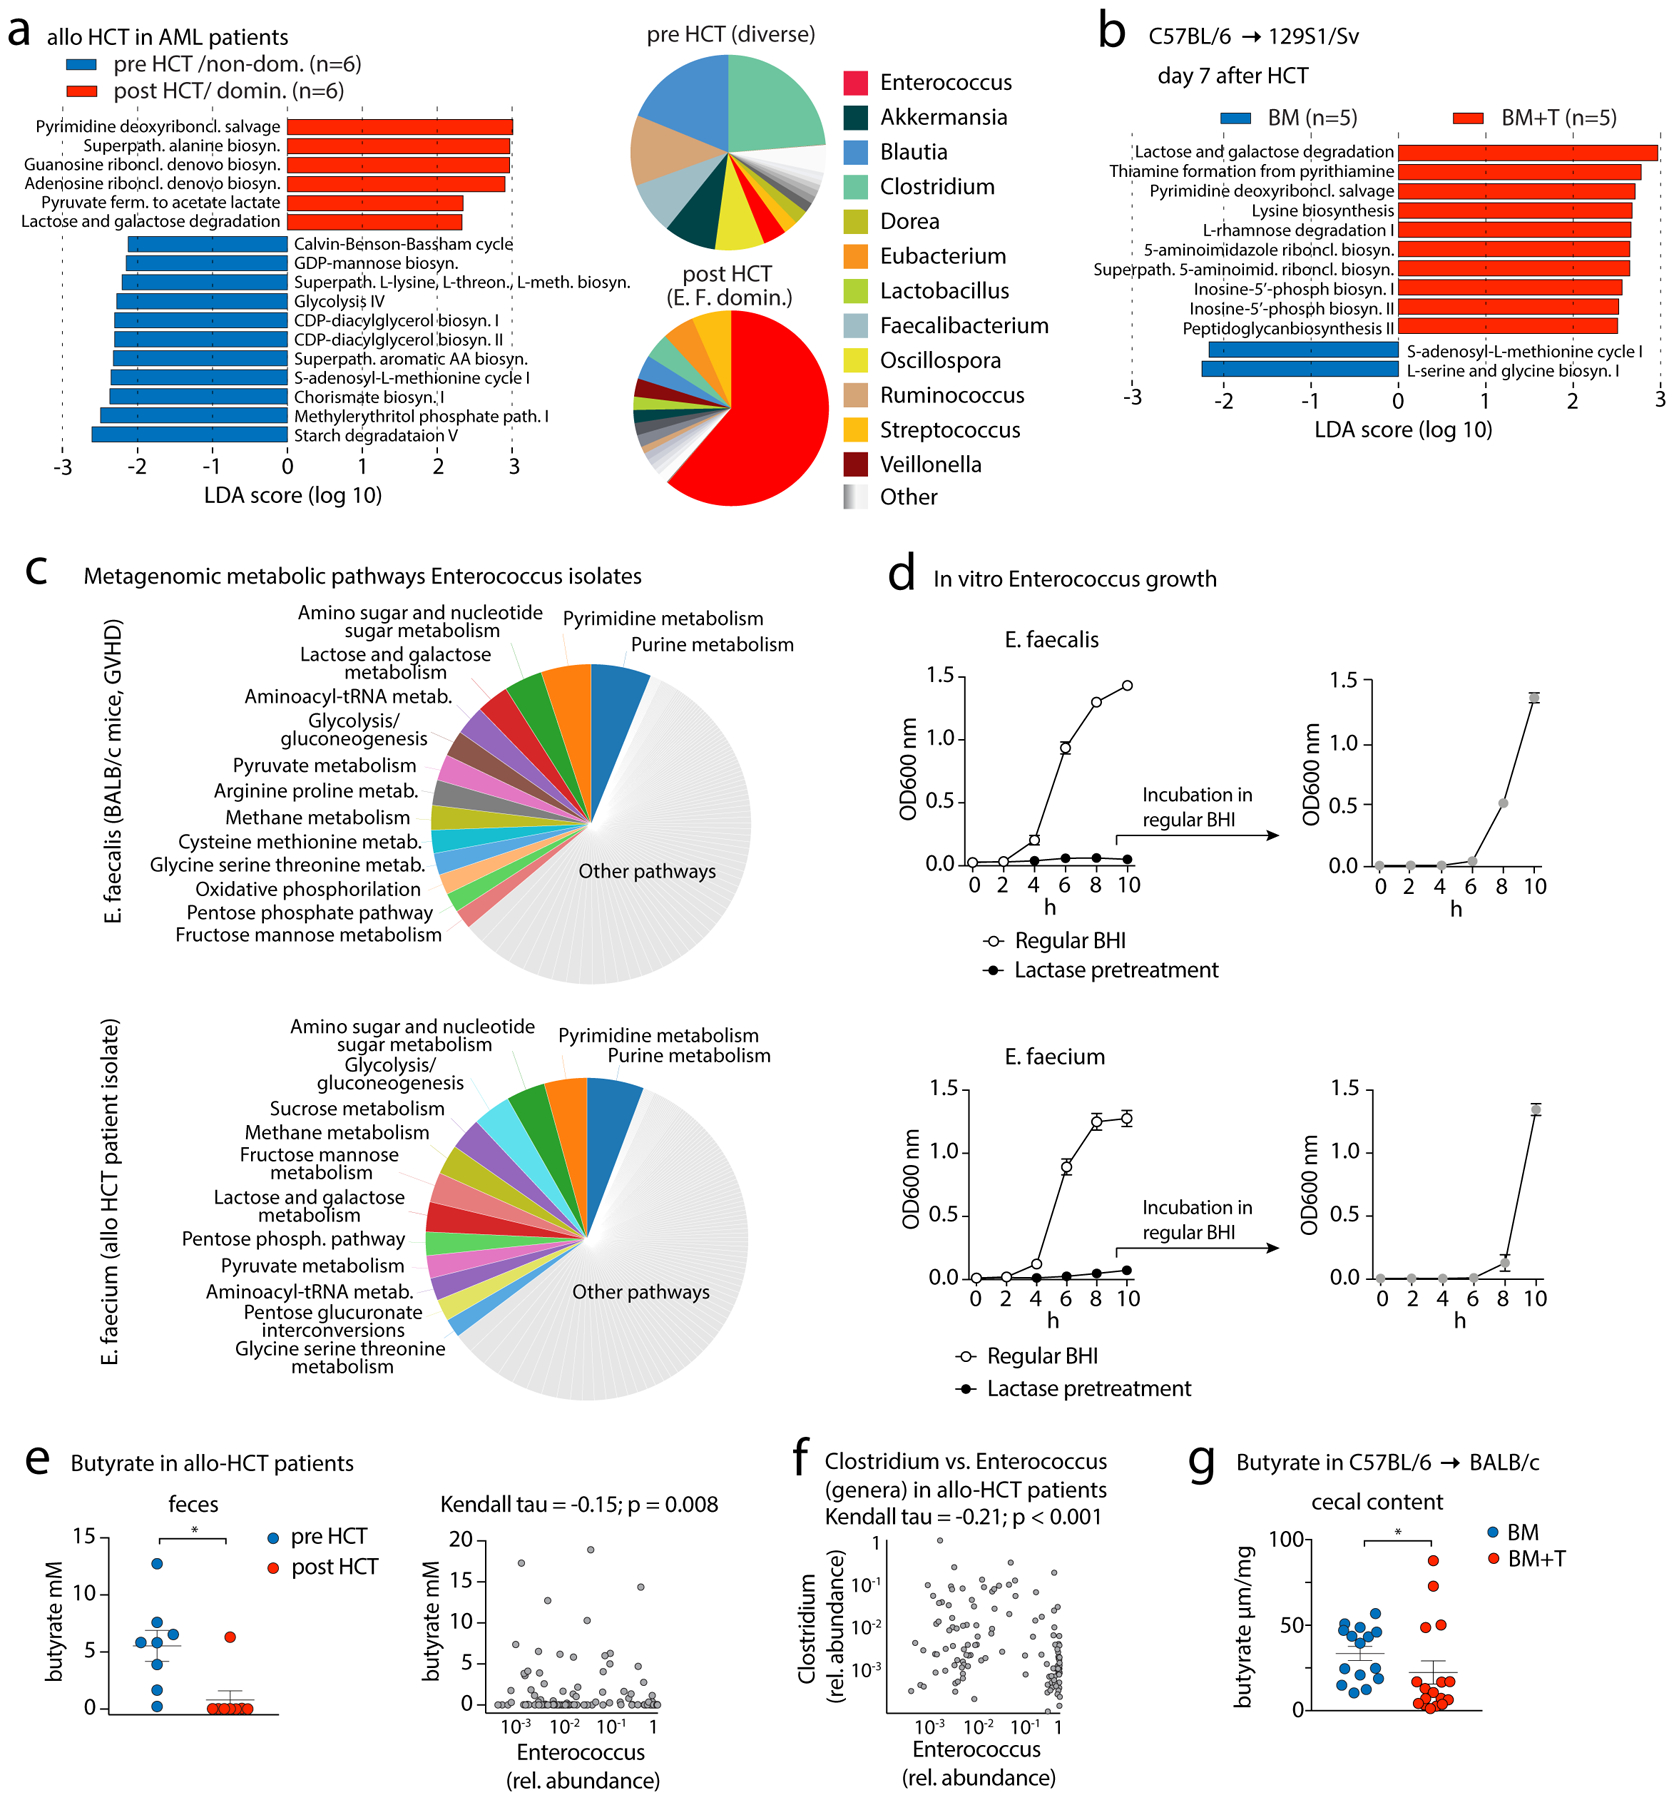
Fig. 3. Metagenomic and metabolomic analyses of Enterococcus-dominated fecal specimens in human HCT patients and mice.

(A) Left, differential abundances of shotgun-sequenced and HUMAnN2-annotated bacterial metabolic pathways between paired pre- and post-HCT fecal samples from MSKCC patients who received allo-HCT for acute myeloid leukemia (AML) analyzed by linear discriminant analysis (LDA) coupled with effect size measurements (LEfSe). (definitions: pre: day −8 to −1; post: day 3–25 after allo-HCT). Right panel, pie chart showing mean relative abundances of bacterial genera (analyzed by MetaPhlAn2) found in patient fecal samples pre- and post-HCT; data are aggregated across all patients. (B) LEfSe analysis of bacterial metabolic pathway abundances in HCT day +7 fecal samples of 129S1/SV mice transplanted with C57BL/6 BM vs BM+T (2×10⁶ T cells) (see Fig. 2A). (C) Left panel, pie chart with metabolic pathway abundances determined by whole genome sequencing of E. faecalis (isolated from feces of a BALB/c GVHD mouse, day +7 after HCT) and E. faecium (human allo-HCT fecal isolate; only pathways with an abundance ≥ 2% are shown). (D) Left panel, in vitro growth of E. faecalis (mouse GVHD isolate; upper panel) and E. faecium (human allo-HCT isolate; lower panel) in non-treated BHI broth or in BHI broth pretreated with lactase. Right panel, E. faecalis or E. faecium incubated in lactase-pretreated BHI were put into regular BHI broth after 8h to assess growth dynamics in regular BHI (grey symbol); 4 experiments combined, values represent mean ±S.E.M. (E) Left panel, fecal butyrate concentrations (mean ±S.E.M.) from pre- and post-transplant fecal samples from AML patients from MSKCC who received allo-HCT and were selected on a highly diverse pre-HCT microbiota and a post-transplant E. faecium domination (by 16S rRNA gene sequencing; 6 (out of 8) patients are presented in Fig. 3A; right panel), correlation of butyrate concentrations with relative abundances of the genus Enterococcus (n=139 patients; 8 patients from Fig. 3E in the left panel), and 131 allo-HCT patients from a dataset published by Haak et al. (29); statistical analysis was performed using Kendall’s tau rank correlation coefficient. (F) Stool samples were collected at the time of engraftment (~24 days after allo-HCT). Data show Kendall’s tau rank correlation of relative abundances of the genera Clostridium and Enterococcus from the data-set of Haak et al. (G) Butyrate concentration (mean ±S.E.M.) in cecal contents of BALB/c mice transplanted with C57BL/6 BM or BM+T (1×10⁶ T cells) at day 7 after HCT. Statistical analysis: *p<0.05 (paired T-test (E) or independent T-test for (F)).
