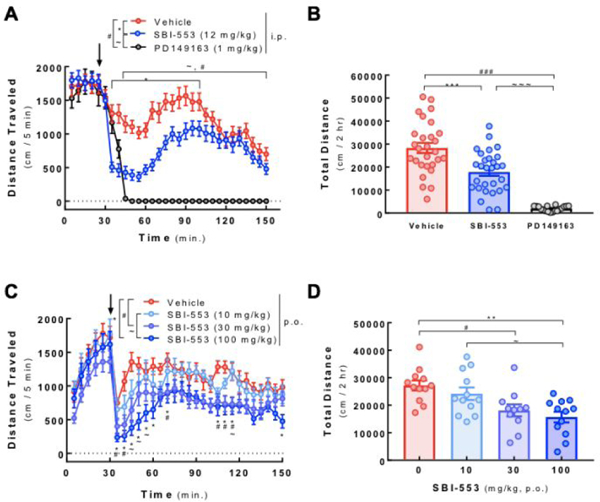
Figure 5: 18 (SBI-553) attenuates basal hyperlocomotion in dopamine transporter knockout (DAT−/−) mice.

Locomotor activity was evaluated using open field automated activity monitors (AccuScan Instruments, Columbus, OH). Male and female DAT−/− mice were acclimated to the open field chamber for 30 min prior to administration of NTR1 ligands (indicated by arrow). After treatment, animals were immediately returned to chambers and horizontal locomotion was monitored over the next 2 hrs. (A) Animals received SBI-553 (12 mg/kg), PD149163 (1 mg/kg) or vehicle (4% DMSO in saline; 10 ml/kg) i.p. Beam breaks in 5 min intervals were recorded to generate horizontal distance traveled per time bin. *p<0.05-p<0.001 Vehicle vs. SBI-553; #p<0.05-p<0.001 Vehicle vs. PD149163; ~p<0.05-p<0.001 SBI-553 vs. PD149163, using a two-way, repeated measures ANOVA (FTime(23, 1679)=13.5, p<0.0001; FTreatment(2, 73)=45.1, p<0.0001; FInteraction(46, 1679)=10.4, p<0.0001) followed by the post hoc Tukey test. (B) Time course data in (A) was summed to determine the total distance traveled in the 2 hr post-treatment. ***,###,~~~p<0.001, as indicated, using one-way ANOVA (F(2, 72)=46.6, p<0.0001) followed by the post hoc Tukey test. Data are represented as mean ± SEM of 18–29 animals per group. (C) Animals received SBI-553 10, 30 or 100 mg/kg or vehicle (distilled H2O) p.o. Beam breaks in 5 min intervals were recorded to generate horizontal distance traveled per time bin. *p<0.05-p<0.001 Vehicle vs. 100 mg/kg SBI-553; #p<0.05 Vehicle vs. 30 mg/kg SBI-553; ~p<0.05 10 mg/kg SBI-553 vs. 100 mg/kg SBI-553, using a two-way, repeated measures ANOVA (FTime(23, 989)=8.6, p<0.0001; FTreatment(3, 43)=6.8, p<0.001; FInteraction(69, 989)=1.1, p=0.2726) followed by the post hoc Tukey test. (D) Time course data in (C) was summed to determine the total distance traveled in the 2 hr post-treatment. **p<0.01, #p<0.05,~p<0.05, as indicated, using one-way ANOVA (F(3, 43)=6.8, p<0.001) followed by the post hoc Tukey test. Data are represented as mean ± SEM of 11–12 animals per group.
