Table 2.
Structures and NTR1 activities of analogs 20
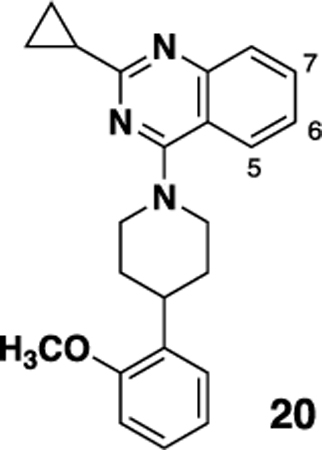 | |||||
|---|---|---|---|---|---|
| Cpd # |
5 | 6 | 7 | EC50, μMa | Emax (%)b |
| 19b | -H | -OCH3 | -OCH3 | 1.04 ± 0.14 | 89 |
| 20a | -H | -N(CH3)2 | -H | 0.888 ± 0.11 (3) |
89 |
| 20b | -H | 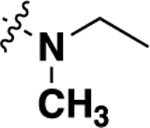 |
-H | 0.56 ± 0.13 | 80 |
| 20c |  |
-H | -H | 6.71 ± 1.54 (3) |
60 |
| 20d | -H |  |
-H | 0.732 ± 0.12 | 68 |
| 20e | -H | -H |  |
10.02 ± 3.95 | 86 |
| 20f | -H |  |
-CH3 | 0.99 ± 0.44 (8) |
86 |
| 20g | -H |  |
-F | 3.01 ± 0.18 (6) |
68 |
| 20h | -H |  |
-H | 1.12 ± 0.13 | 79 |
| 20i | -H |  |
-H | 0.478 ± 0.08 | 92 |
| 20j | -H |  |
-H | 0.81 ± 0.10 | 92 |
| 20k | -H |  |
-H | 6.72 ± 1.59 | 82 |
| 20l | -H |  |
-H | 2.78 ± 0.57 | 79 |
| 20m | -H | 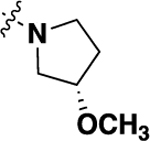 |
-H | 0.81 ± 0.25 (8) |
82 |
| 20n | -H | 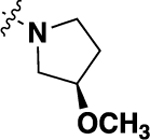 |
-H | 0.64 ± 0.29 (12) |
93 |
| 20o | -H | 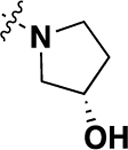 |
-H | 1.01 ± 0.23 (8) |
78 |
| 20p | -H | 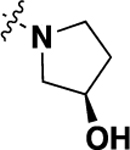 |
-H | 0.44 ± 0.16 (8) |
79 |
β-Arrestin2-GFP NTR1 potency measured relative to the EC100 (100 nM) of the NT(8–13) peptide control average ± SEM (n=4 unless otherwise noted);
Emax was calculated as the % of the response obtained with NT(8–13) peptide. None of the compounds from this series showed activity in the NTR2 (>80 μM) counterscreen.
