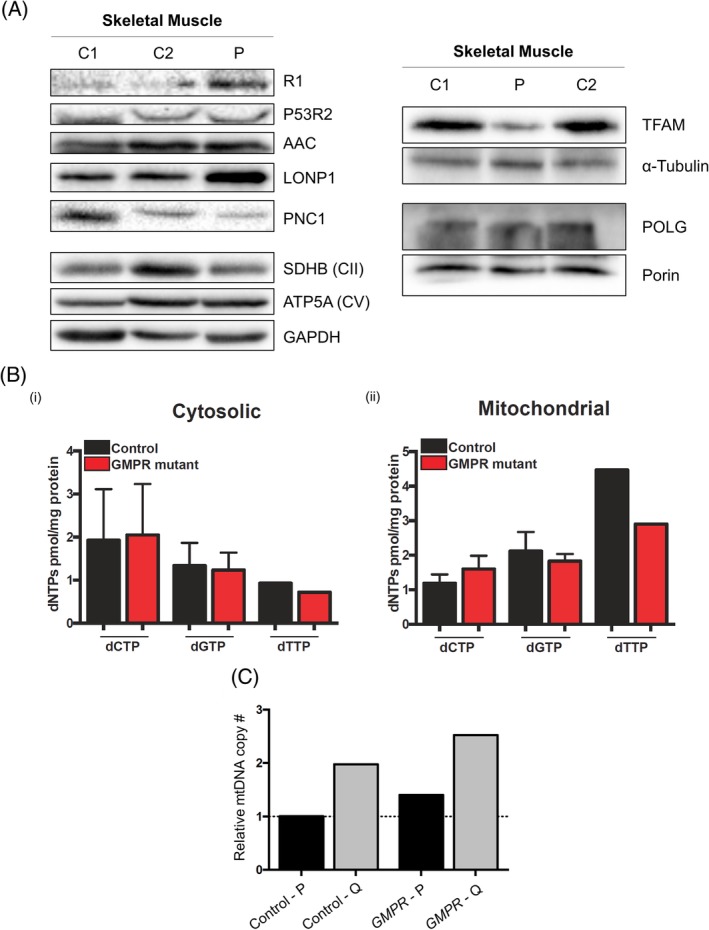
Figure 3.

Assessment of nucleotide homeostasis and mtDNA machinery markers in skeletal muscle and cytosolic and mitochondrial dNTP measurements in quiescent cells. A, Steady‐state proteins levels of nucleotide homeostasis and mtDNA maintenance markers in control and GMPR patient skeletal muscle homogenates. GAPDH, α‐tubulin and porin were used as loading controls. OXPHOS subunits SDHB (CII) and ATP5A (CV) were also used as markers to confirm protein loading. B, Cytosolic (left) and mitochondrial (right) dNTP levels in quiescent GMPR mutant and control fibroblasts. C, Relative mtDNA copy number in GMPR patient and control proliferating (P) and quiescent (Q) fibroblasts. Relative mtDNA copy number was expressed as fold change relative to one proliferating control [Colour figure can be viewed at http://wileyonlinelibrary.com]
