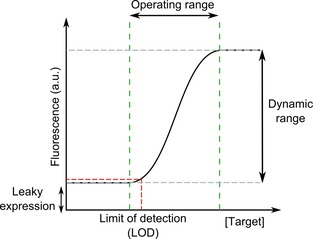
Figure 4.

Characteristics of a typical biosensor response curve: The dynamic range is ratio between the minimum and maximum output expression ( ). The limit of detection (LOD) is the lowest concentration of the target which can be detected from the background response. The leaky expression is the level of reporter present when no target is present. These characteristics are commonly used to define the response of the biosensor. The operating range gives the concentrations of target which can be detected through a change in the output.
