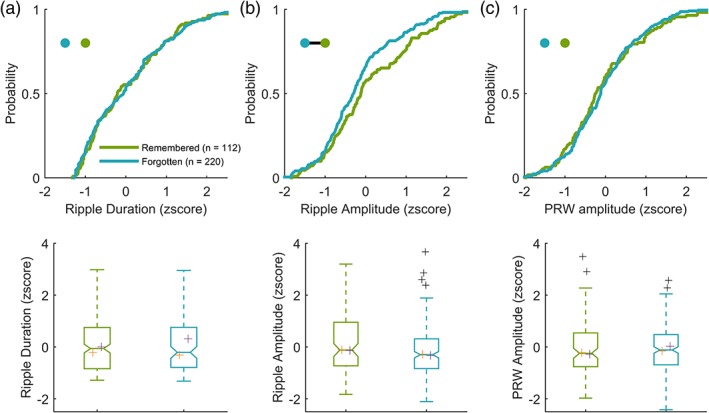
Figure 3.

SWR amplitude, but not duration or PRW amplitude, is greater during remembered trials during the goal‐directed visual search. Top: cumulative probability distribution. Blackline connecting dots in the top left inset of top panels indicates p < .05 between groups, as represented by dot color. Bottom: boxplots of corresponding distributions above. Median values for each animal are plotted in orange (LU) and purple (LE) crosses for SWR duration (a), amplitude (b), and PRW amplitude (c) during remembered (n = 220) and forgotten (n = 112) trials
