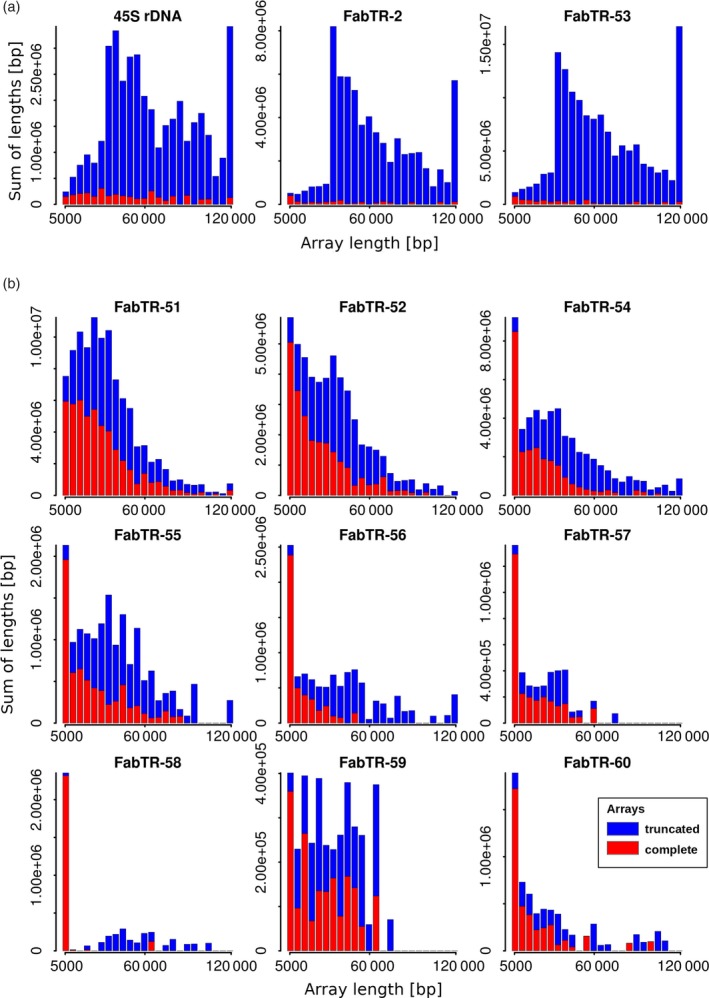
Figure 2.

Length distributions of the satellite repeat arrays. The lengths of the arrays detected in the nanopore reads are displayed as weighted histograms with a bin size of 5 kb; the last bin includes all arrays longer than 120 kb. The arrays that were completely embedded within the reads (red bars) are distinguished from those that were truncated by their positions at the ends of the reads (blue bars). Due to the array truncation, the latter values are actually underestimations of the real lengths of the corresponding genomic arrays and should be considered as lower bounds of the respective array lengths. Tandem repeats forming long arrays are shown in panel (a), while the remaining repeats forming predominantly short arrays are in panel (b).
