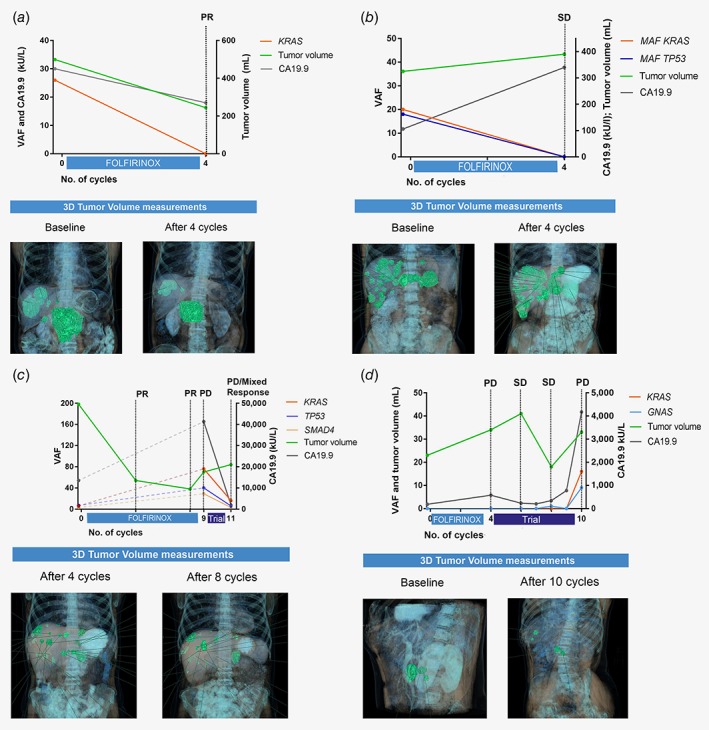
Figure 3.

ctDNA dynamics in four individual patients during follow‐up. (a) Tumor volumes, CA19.9 and ctDNA VAF all showed similar dynamics. (b) CA19.9 and ctDNA VAF showed opposite responses in relatively stable tumor volume. (c) While VAF and CA19.9 showed similar trends in this patient, tumor volume differed. NB: One follow‐up measurement showed a KRAS VAF of 76%, indicating amplification of KRAS. The measurement was confirmed with ddPCR and observed again in the consecutive sample collected 2 weeks later (no treatment was started in the interval). (d) ctDNA and CA19.9 showed similar trends. Abbreviations: PD, progressive disease; PR, partial response; SD, stable disease; all according to RECIST 1.1. In the lower parts of the figures (illustrations), 3D tumor volumes are shown in green. The left and right Y‐axes represent different parameters in per subfigure, as the absolute values of the three parameter (ctDNA, CA19.9, tumor volumes) differed widely.
