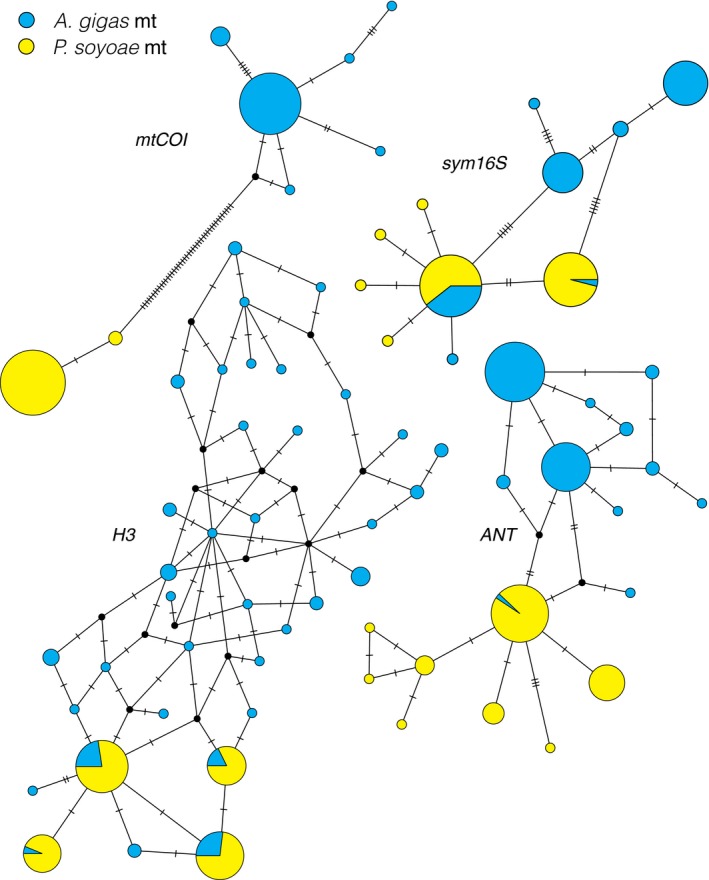
Figure 2.

Haplotype network for host (mtCOI, ANT, H3) and symbiont (sym16S) genes. Each circle represents a single haplotype where circle size is proportional to frequency in the data set. Lines on connecting branches indicate number of mutations between haplotypes. For ANT, H3 and sym16S, P. soyoae‐specific alleles (yellow) are found in A. gigas (blue)
