
Figure 4.
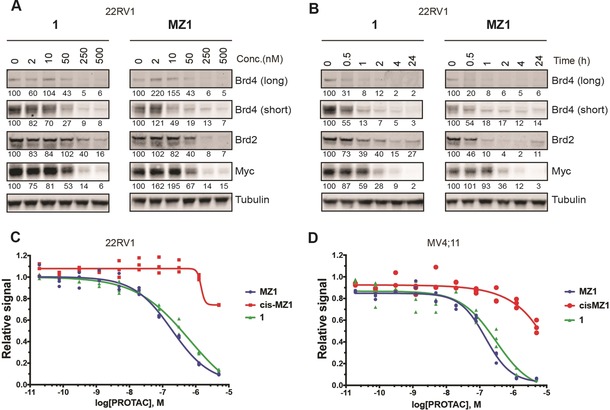
Cellular activity of macroPROTAC‐1. A) 22RV1 cells were treated with different concentrations of 1 or MZ1 for 4 h. B) 22RV1 cells were treated with 500 nm of 1 or MZ1 for different times. In (A) and (B), protein levels were analyzed by western blotting using the corresponding antibodies after SDS‐PAGE. The quantity of protein in each band is shown as a percentage underneath. Each band was normalized relative to tubulin and the untreated condition. C,D) Antiproliferative activity of 1, MZ1, and cisMZ1. 22RV1 (C) and MV4;11 (D) cells were treated with compounds for 72 and 48 h, respectively, prior to quantitation of cell proliferation using the CellTiter‐Glo luminescent cell viability assay.