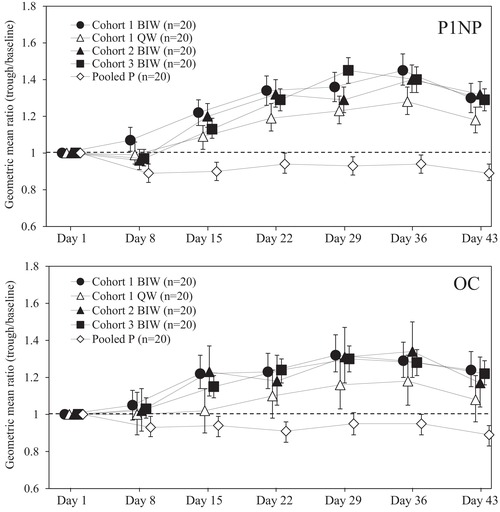
Figure 3.

Estimated geometric mean ratios and 95% confidence intervals of trough levels to baseline levels in serum bone formation markers. Each point represents the estimated geometric mean ratio and its 95% confidence interval. The dashed line indicates the estimated geometric mean ratio as 1. BIW, twice‐weekly 28.2‐μg injection group; OC, intact osteocalcin; P1NP, type 1 procollagen‐N‐propeptide; pooled P, pooled placebo group; QW, once‐weekly 56.5‐μg injection group.
