Figure 3.

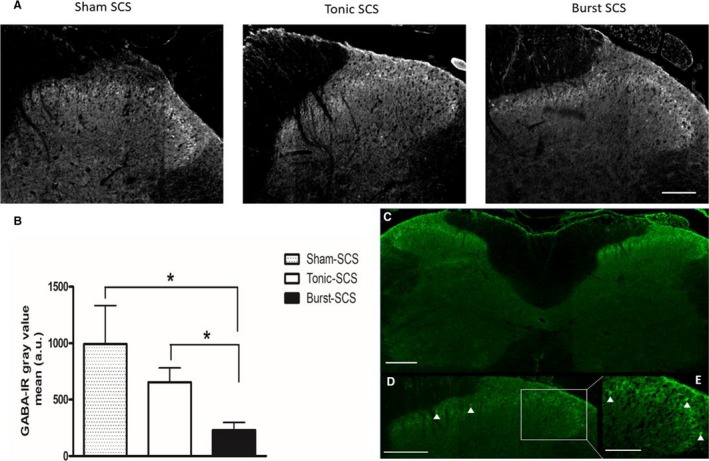
A, Spinal cord stimulation (SCS)‐induced alterations in intracellular GABA levels in the L4–L6 spinal dorsal horn. Representative gray scale photomicrographs of the upper laminae of the ipsilateral dorsal horn of a sham SCS animal, tonic SCS animal, and burst SCS animal. Scale bar = 100 μm. B, Quantified GABA‐IR in laminae 1 to 3 of the L4–L6 spinal dorsal horn of sham SCS animals (n = 4), tonic SCS animals (n = 7), and burst SCS animals (n = 5). *P < 0.05. C, Representative overview of the immunostaining of the left and right dorsal horn of the spinal cord. Scale bar = 100 μm. D, Arrowheads point out activated GABA‐IR neuronal profiles. Scale bar = 100 μm. E, Arrowheads point out activated GABA‐IR neuronal profiles. Scale bar = 50 μm. MT, motor threshold; WT, withdrawal threshold.
