
Figure 4.
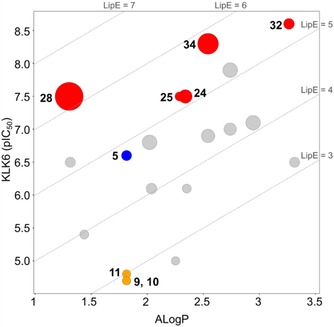
Lipophilicity plot of the compounds in this manuscript. The size of each dot represents selectivity over trypsin, with a larger dot indicating better selectivity. Trypsin data was used for this plot because trypsin data was generated for each compound and because trypsin activity varied significantly between derivatives. ALogP was calculated using Pipeline Pilot. Blue=hit substance. Yellow=stereoisomers of the hit. Red=potential leads.