Figure 2.

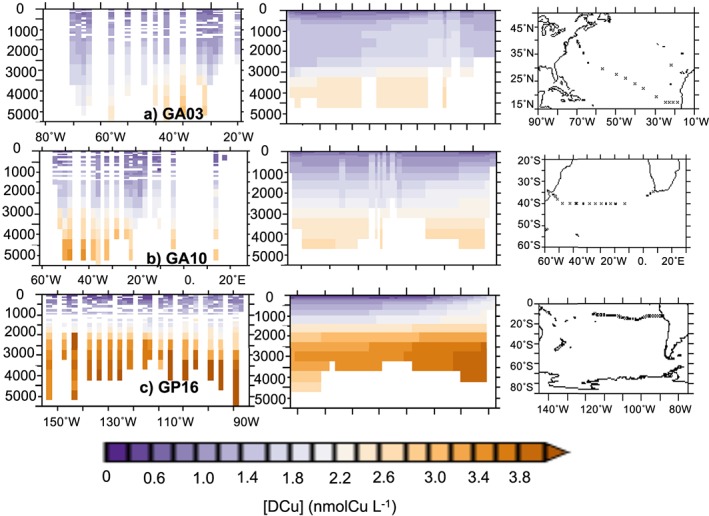
Average [DCu] (nmol/L) along the GA03 (a), GP10 (b), and GP16 (c) GEOTRACES cruises. Left panels represent the data, middle panels the REF simulation, and right panels cruise tracks.

Average [DCu] (nmol/L) along the GA03 (a), GP10 (b), and GP16 (c) GEOTRACES cruises. Left panels represent the data, middle panels the REF simulation, and right panels cruise tracks.