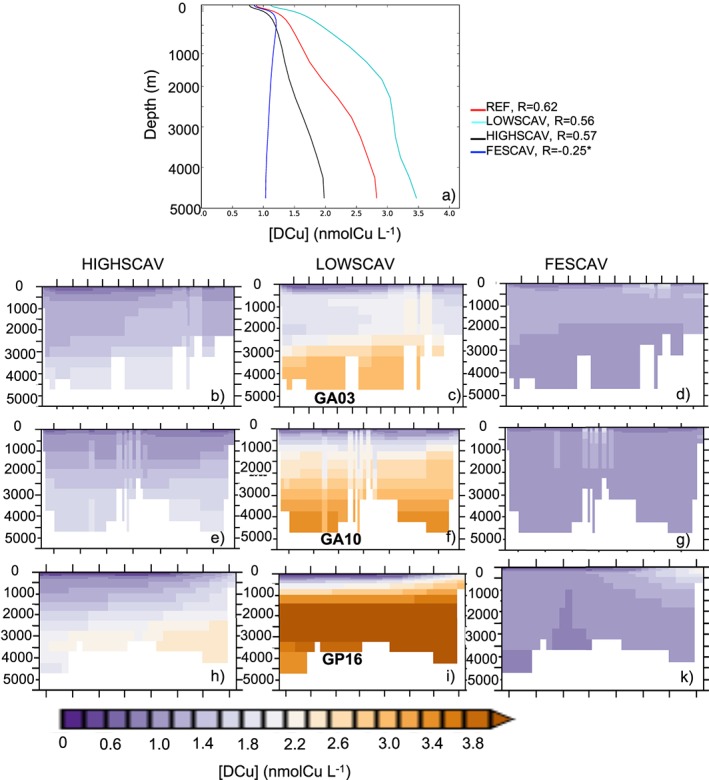
Figure 4.

(a) Average profiles of [DCu] in the global ocean from REF and all the SCAV simulations. Numbers represent the regression fit (R) between [DCu] and depth; the star indicates that the statistical regression is not significant (p value > 1%). The (b) to (k) represent [DCu] in HIGHSCAV (b, e, and h), LOWSCAV (c, f, and i), and FESCAV (d, g, and k) along the GA03, GA10, and GP16 cruise sections. See Figure 2 for the data and REF concentrations.
