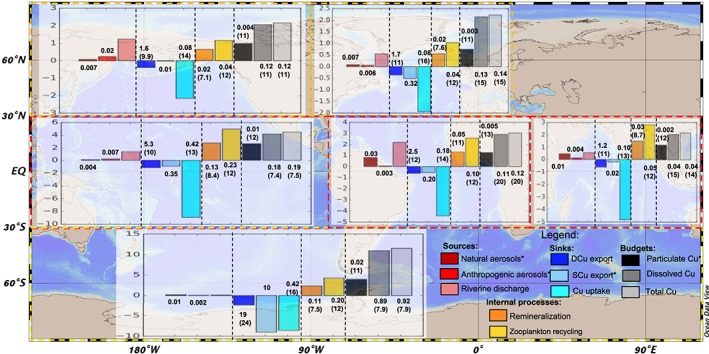
Figure A1.

Barplot of total Cu budgets and fluxes in the first 100 m (in Gmol/year) in different oceanic regions. High latitudes: >60°N or <60°S. Midlatitudes: between 30° and 60° N or S. Equatorial: between 30°S and 30°N. The numbers above the bars represent the average fluxes or concentrations. Numbers in parentheses are the Cu:C ratio of the component (10−6 molCu:molC). Aerosol deposition and export fluxes are given in 10−6 molCu·m−2·year−1; phytoplankton uptake, remineralization, and zooplankton recycling are given in 10−6 molCu·m−3·year−1; particulate, dissolved, and total coppers are the average concentrations in the first 100 m (in 10−6 molCu/m3). Total copper represents copper in the dissolved and particulate phases. Legends with a star (*) indicate that the value has been multiplied by 10 in the plot for visualization.
