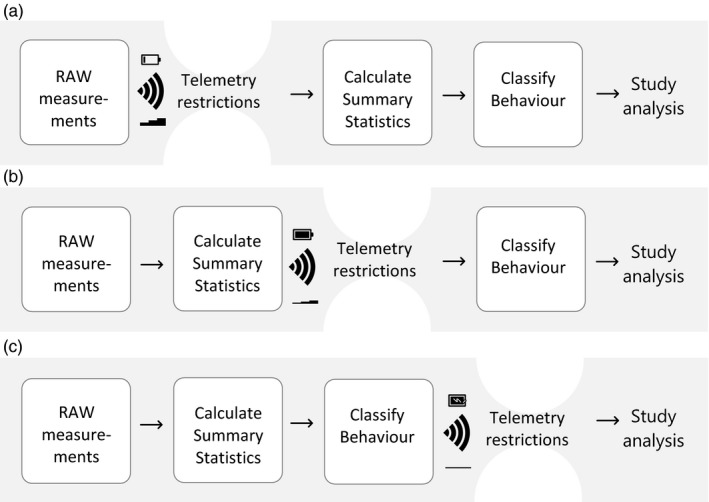
Figure 2.

Graphical representation of data collection schemes in this study. (a) Raw accelerometer (ACC) data scenario. Raw acceleration data are collected by the biologging device and sent via the network to a server. The raw data represent a large amount of data and transmission is costly in terms of energy usage. Only after transmission, the ACC data will be summarized and classified to behaviour. (b) Summary statistics scenario. Raw acceleration data are collected by the biologging device and summary statistics per bout from these ACC data, such as average x or Overall Dynamic Body Acceleration (ODBA) are calculated on‐board. The summary statistics comprise less data and thus take less energy to be transmitted to the server. From the summary statistics, behaviour can be classified for further analysis. (c) Behaviour indicator scenario. Raw acceleration data are collected by the biologging device, summary statistics are calculated and the behaviour is classified on‐board. This results in only a single indicator being sent via the network to the server, using only very little energy for transmission. Scenarios (a) and (b) are compared in this study, scenario (c) represents a next step in the developments of accelerometer research
