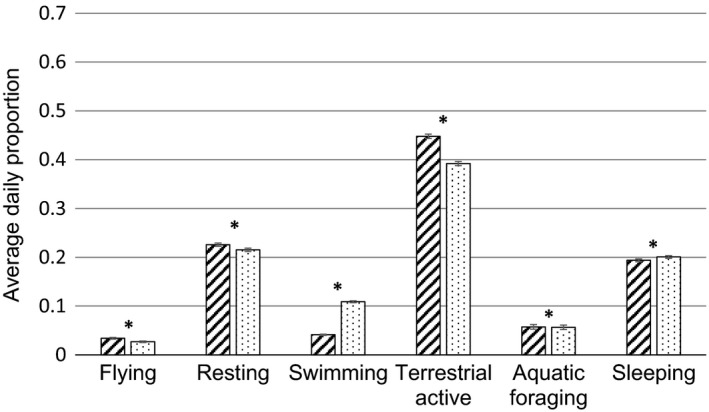
Figure 4.

Daily proportions per behaviour for spring 2017 (1 February–31 May), M ± SE, N = 1,200. Bars with diagonal lines represent the data based on summary statistic data (i.e. the short bout interval), bars with dots represent the data based on the raw accelerometer (ACC) data (i.e. the long bout interval). For all behaviours, the difference between the proportions of both methods were statistically significant (p ≪ .0001, indicated by * in the figure)
