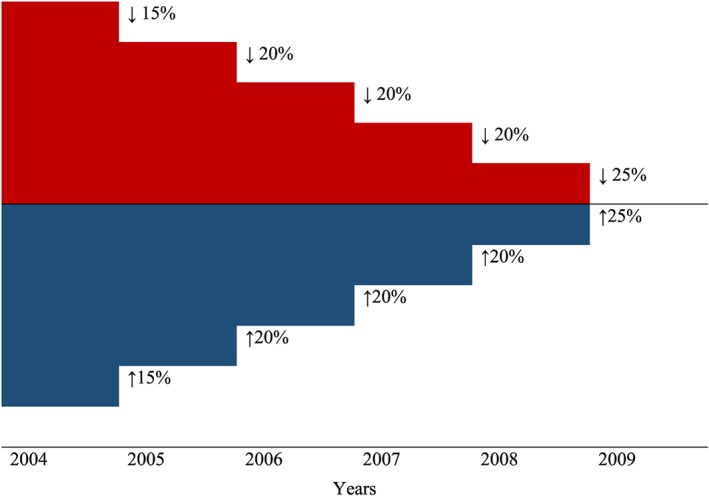
Figure 1.

Convergence of base rates (schematic illustration). Note: This figure shows a schematic illustration for the reduction of initial differences in base rates during the convergence period [Colour figure can be viewed at http://wileyonlinelibrary.com]
