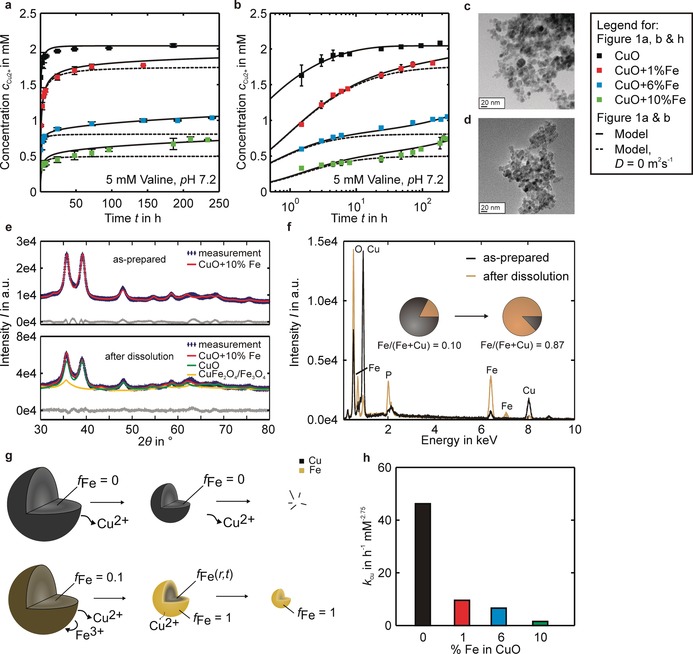
Figure 2.

Pharmacokinetics and model for Fe‐doped CuO NPs. a) Cu2+ release profiles for pure, 1, 6, and 10 % Fe‐doped CuO in 5 mm valine solutions. The release behavior in 5 mm threonine, isoleucine, and serine solutions in Figure S2 a–f was similar. b) The logarithmic time scale shows the presence of two release processes for 6 and 10 % Fe‐doped CuO. The initial fast Cu2+ release from the CuO surface followed by a slower long‐term release from the bulk. c,d) TEM images of 10 % Fe‐doped CuO particles before and after dissolution for four weeks in 50 mm valine solution. The primary particle size and sphericity is decreased after dissolution. Similar observations were made for 6 % Fe‐doped CuO in Figure S2 a,b. e) Powder diffraction (XRD) patterns of 10 % Fe‐doped as‐prepared samples are primarily composed of the CuO phase. After dissolution, a spinel phase (CuFe2O4 or Fe3O4) formed for the 6 % (Figure S3 c) and 10 % Fe‐doped samples and the peak broadening clearly demonstrates a decreased crystallite size. f) EDX spectra (Tables S2 and S3) of the 10 % Fe‐doped samples show an increasing iron content after dissolution going beyond the release of surface available copper (Figure S5). The increased oxygen peak is likely due to the formation of the spinel. g) Differences in dissolution of pure and Fe‐doped CuO NPs, as described by the model presented in the Supporting Information. The Cu2+ release of pure CuO NPs results in complete dissolution. For Fe‐doped CuO the iron‐copper ratio increases during dissolution, which describes the initial release of surface available copper until an insoluble Fe‐shell forms. Further dissolution is limited by a diffusive transport of copper from the bulk to the surface. The Fe/Cu ratio becomes a function of the radial position and time, in which the dissolution stops after all copper is removed from the particle. With the three model parameters, k Cu, k #,s and D, the release kinetics in (a), (b), and Figure S2 a–f (solid lines) are reasonably explained. h) Rate constants k Cu obtained from the model decrease with increasing iron‐copper ratio f Fe,0, as the Cu−O bond length varies owing to Jahn–Teller distortion and a phase transformation from CuO to CuFe2O4 occurs during dissolution.7b
